My Aquarium Runs on the Same Stack as My Cluster

TL;DR: My four aquariums are wired into the same patterns I run at work. Zigbee plugs and a Raspberry Pi called HydroSense are the exporters. A local MQTT broker next to Home Assistant, bridged into a three-node VerneMQ cluster on Kubernetes, is the event bus. Home Assistant is the reconciler: it re-asserts the light schedule every 15 minutes. Telegraf, InfluxDB and Grafana are the TSDB. This post is the map. I trace one real automation through every layer, with timestamps from the database, and then list what broke on the way.
An incident you cannot roll back
At work, a bad deploy has an undo button: Argo Rollouts keeps the previous ReplicaSet around. A heater relay that sticks on at 2 a.m. has no previous revision. Water does not roll back to 25 degrees, and the fish do not get restored from a Longhorn snapshot.
That asymmetry is why this stack looks the way it does. I wanted to stop finding out about problems by looking at the tank, so I reached for tools whose failure modes I know.
I have written about the two halves before: the hobby in Balance, the Heartbeat of a Planted Aquarium and When Work and Passion Start Speaking the Same Language, the hardware in The Aquarium Hobby: It’s Not a Philosophy, It’s a Survival Strategy, and the first data path in Unifying My Smart Home and Homelab. This post ties them together.
The map
flowchart LR
  subgraph home["At home"]
    plugs["Zigbee plugs<br/>lights, filters"] --> z2m["zigbee2mqtt"]
    z2m --> lb["local MQTT broker<br/>(Home Assistant RPi5)"]
    hs["HydroSense<br/>Pi Zero W: backlight, 2 dosers"] --> lb
    ha["Home Assistant"] <--> lb
  end
  lb --> vmq
  subgraph k8s["Cluster"]
    vmq["VerneMQ, 3 nodes<br/>pulls from the home broker<br/>over a bridge on one node"] --> tg["Telegraf"]
    tg --> mqttb[("InfluxDB<br/>bucket mqtt")]
    mqttb --> gf["Grafana<br/>Aquarium Monitoring"]
    hab[("InfluxDB<br/>bucket homeassistant<br/>history pushed by Home Assistant")]
  end
  ha --> hab
The same picture as a table, with the thing each layer is at work:
| Layer | In the fish room | At work |
|---|---|---|
| Signals | Zigbee smart plugs via zigbee2mqtt; HydroSense on a Raspberry Pi Zero W | exporters |
| Event bus | a local broker on the Home Assistant Pi, bridged into a 3-node VerneMQ cluster | Kafka, any event bus |
| Reconciler | Home Assistant automations | an operator’s control loop |
| TSDB | Telegraf, InfluxDB, Grafana | Prometheus, VictoriaMetrics |
HydroHabitat, my own aquarium app, is in the final phase of development.
Two design decisions shape everything below.
The automations live at home, the history lives in the cluster. Home Assistant talks to its own broker on the same Raspberry Pi 5. If the cluster or the VPN link disappears, the lights still switch on at two in the afternoon. The cluster is downstream: it gets a copy of every message and is allowed to fail.
The event bus is pulled, the history is pushed. The MQTT bridge runs on the VerneMQ side and subscribes to the Home Assistant broker over the VPN, so the broker at home does not know the cluster exists. Home Assistant’s InfluxDB integration, though, writes state history straight into the homeassistant bucket, and the automations never wait for it.
Layer 1: signals (exporters)
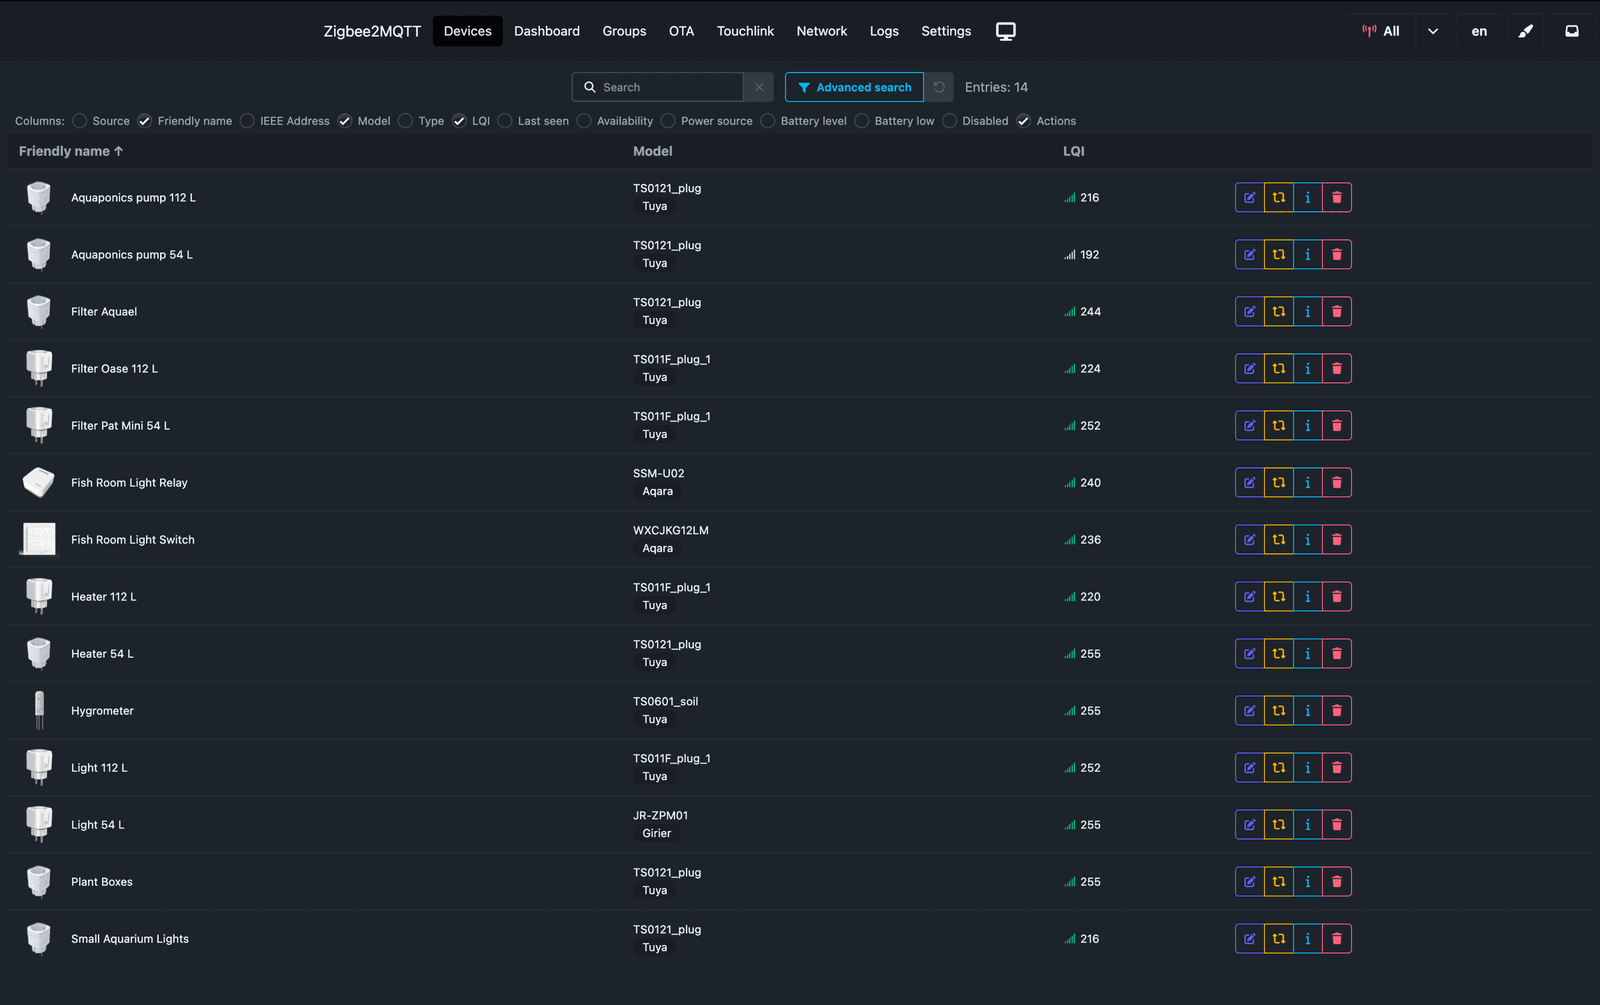
An exporter does not know what it is measuring for. node-exporter reports a filesystem filling up, with no opinion about the database on it. A Zigbee smart plug does the same for a fish tank: it reports watts, volts, amps and link quality for whatever is plugged into it, and the meaning comes later.
The second source is HydroSense, the project that started as a drawer of old parts in the survival strategy post. Today it is a FastAPI service on a Raspberry Pi Zero W that drives the LED backlight and two Jebao dosing pumps, and publishes on hydrosense/....
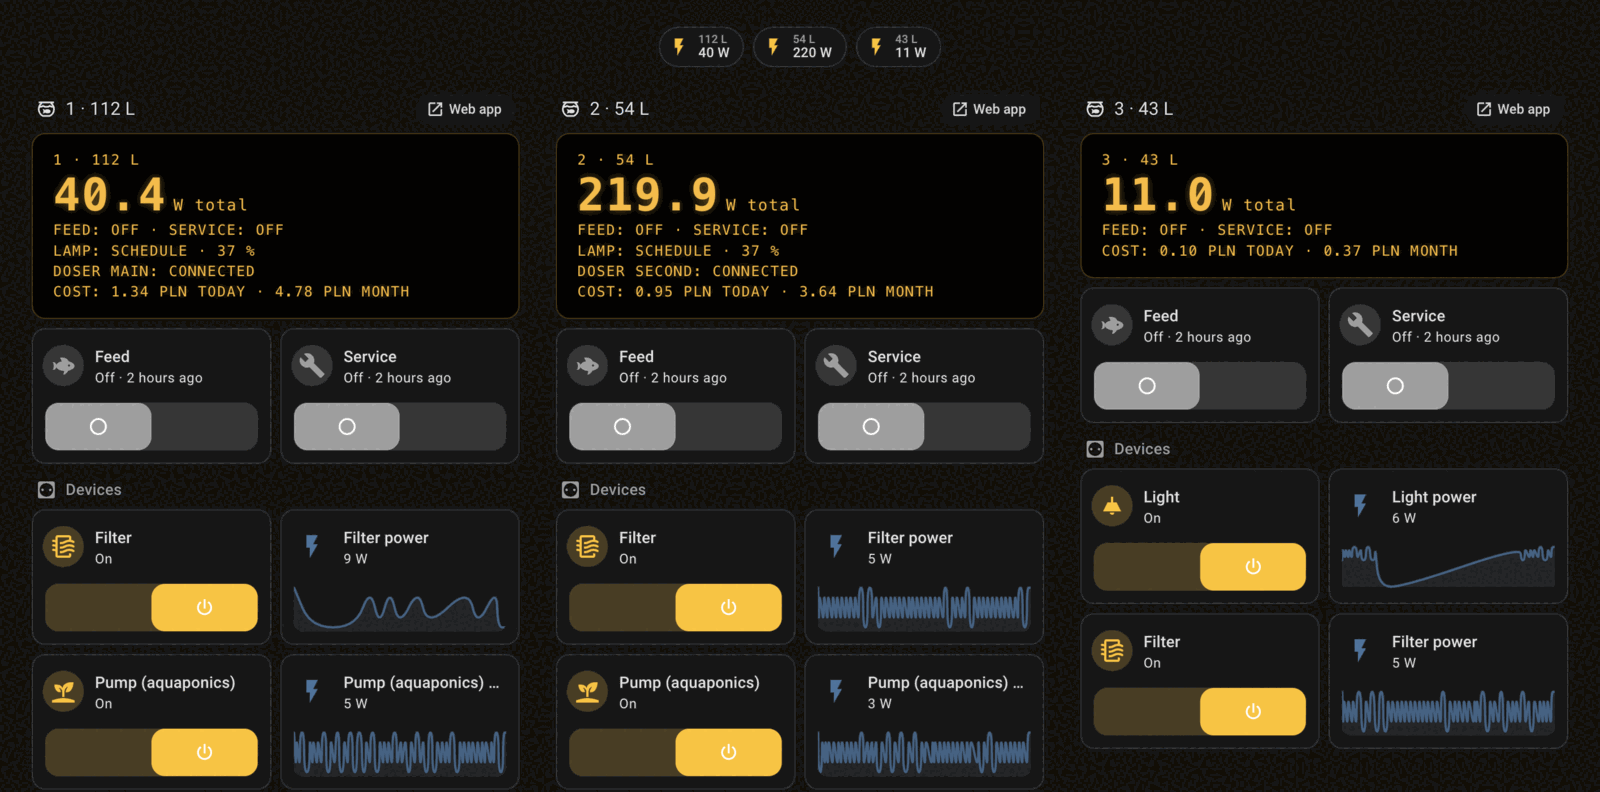
Subscribing inside the cluster shows what made it across the bridge (two messages):
zigbee2mqtt/Heater 54L {"current":0.82,"energy":1166.15,"indicator_mode":"off/on","linkquality":252,"power":190,"power_outage_memory":"on","state":"ON","voltage":236}
hydrosense/hs01/tank_54/state {"feed": false, "feed_ends_at": null, "service": false, "error": null, "temperature": null, "water_level": null, "mode": null, "power_w": 194.9, "filter": true, "filter_power_w": 4.9, "filter_energy_kwh": 7.43, "heater": true, "heater_power_w": 190.0, "heater_energy_kwh": 1166.15, "light": false, "light_power_w": 0.0, "light_energy_kwh": 400.79, "pump": true, "pump_power_w": 0.0, "pump_energy_kwh": 720.08}
The first is a raw plug report from zigbee2mqtt; the second is HydroSense folding the same plug readings into a per-tank state.
Layer 2: the event bus (two brokers, on purpose)
There are two brokers with different jobs. The local broker on the Home Assistant Pi is the one the devices and the automations talk to. It is a single node, deliberately: it has to be as available as the Pi it runs on and no more.
The cluster broker is VerneMQ, three nodes on Kubernetes. It replaced a three-node EMQX in four pull requests merged the same evening. The bridge and Telegraf subscribe here.
Why VerneMQ, and why built from source
| Option | License | Clustering | Verdict |
|---|---|---|---|
| EMQX, last Apache-2.0 line | Apache-2.0 | yes | my Trivy scan: 8 Critical, 141 High |
| EMQX, newer releases | BSL 1.1: production use of a single node is free, a cluster needs a license file | with a license file | no |
| VerneMQ packages and Docker images | VerneMQ EULA, not applicable to commercial use | yes | not allowed here |
| VerneMQ built from source | Apache-2.0 | yes | chosen |
| NanoMQ, Mosquitto | NanoMQ is MIT; for Mosquitto the license is not the issue | no clustering in either core that I found | no |
So I build VerneMQ from source through my usual pipeline: Trivy scan and cosign signature. Trivy reported 0 Critical, High or Medium on the local test build. Clustering is what I am paying for, and building from source is the price.
The bridge runs on one node only
The pull bridge runs on one node and nowhere else, because one bridge per node would deliver every message three times. When that node restarts, the house broker keeps QoS 1 messages for the bridge’s session and they arrive late, not never.
Layer 3: Home Assistant (the reconciler)
A Kubernetes controller compares desired state with observed state, acts on the difference, and does it again on a timer, so a missed event or a manual change gets corrected on the next pass. Home Assistant runs my aquarium lights that way. Two automations, turn_on_aquarium_lights and turn_off_aquarium_lights, cover the four light switches. Both trigger every 15 minutes around the clock, and a time condition decides which one acts: the on one from 14:00 to 22:00 local time, the off one for the rest of the day. A state trigger also puts a light back at once if I switch it by hand or a plug returns as off. A watch plus a resync period is how a controller is built.
alias: Turn on aquarium lights
triggers:
  - trigger: time
    at: "14:00:00"
  - trigger: homeassistant
    event: start
  - trigger: state
    entity_id:
      - switch.light_112l
      - switch.light_54l
      - switch.plant_boxes
      - switch.small_aquarium_lights
    to: "off"
  - trigger: time_pattern
    minutes: /15
conditions:
  - condition: time
    after: "14:00:00"
    before: "22:00:00"
actions:
  - action: switch.turn_on
    target:
      entity_id:
        - switch.light_112l
        - switch.light_54l
        - switch.plant_boxes
        - switch.small_aquarium_lights
turn_off_aquarium_lights is the mirror image.
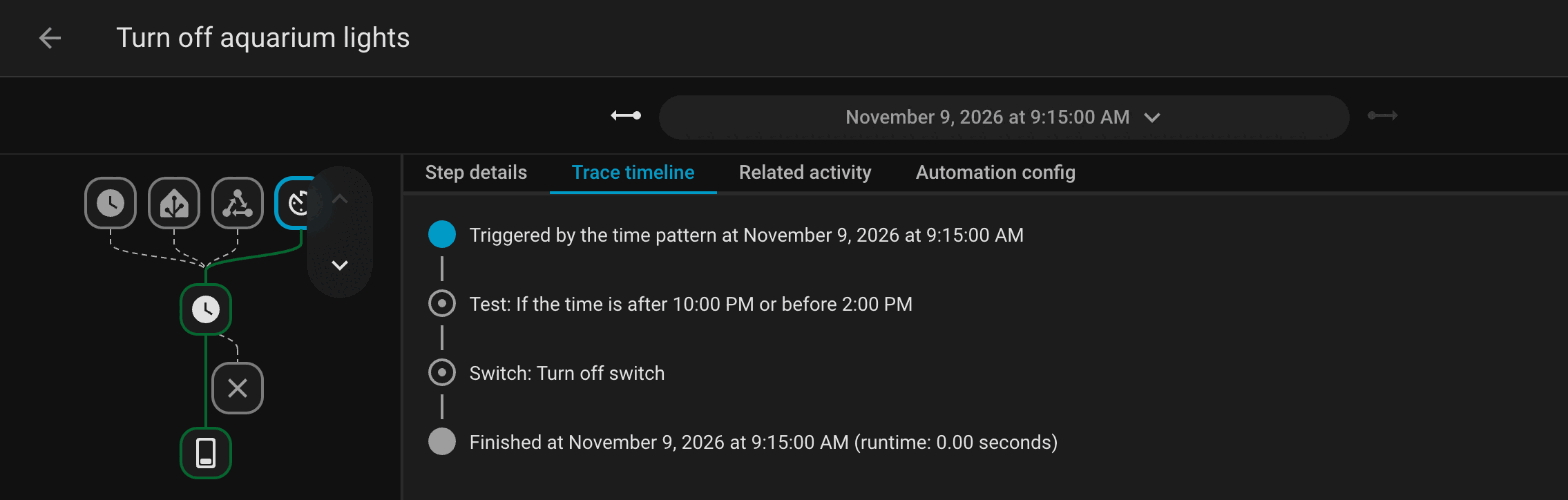
Re-applying desired state is only safe if the controller cannot be wrong in a loop. HydroSense taught me that, and the story is below.
Both heaters have their own thermostats, and their plugs report watts like every other plug: the 54 L one cycles between 0 and about 200 W. HydroSense’s service mode can also switch them off, for a bounded time. If a thermostat fails closed, the heater stays on and nothing in the stack notices yet. The second opinion I am adding is a temperature probe per tank, with HydroSense cutting the plug above a limit. Until it exists, a Grafana alert fires when a heater’s power has not dropped to 0 W for three hours.
Layer 4: InfluxDB and Grafana (the TSDB)
Telegraf subscribes to VerneMQ with one input per topic tree (zigbee2mqtt/+ and hydrosense/+/+/state) and a persistent session, so a pod restart does not drop queued messages. It writes to InfluxDB, bucket mqtt, retention infinite, on a Longhorn volume in the daily backup set.
Home Assistant writes its own state history into a second bucket, homeassistant, which is where the automation timestamps in the trace below come from.
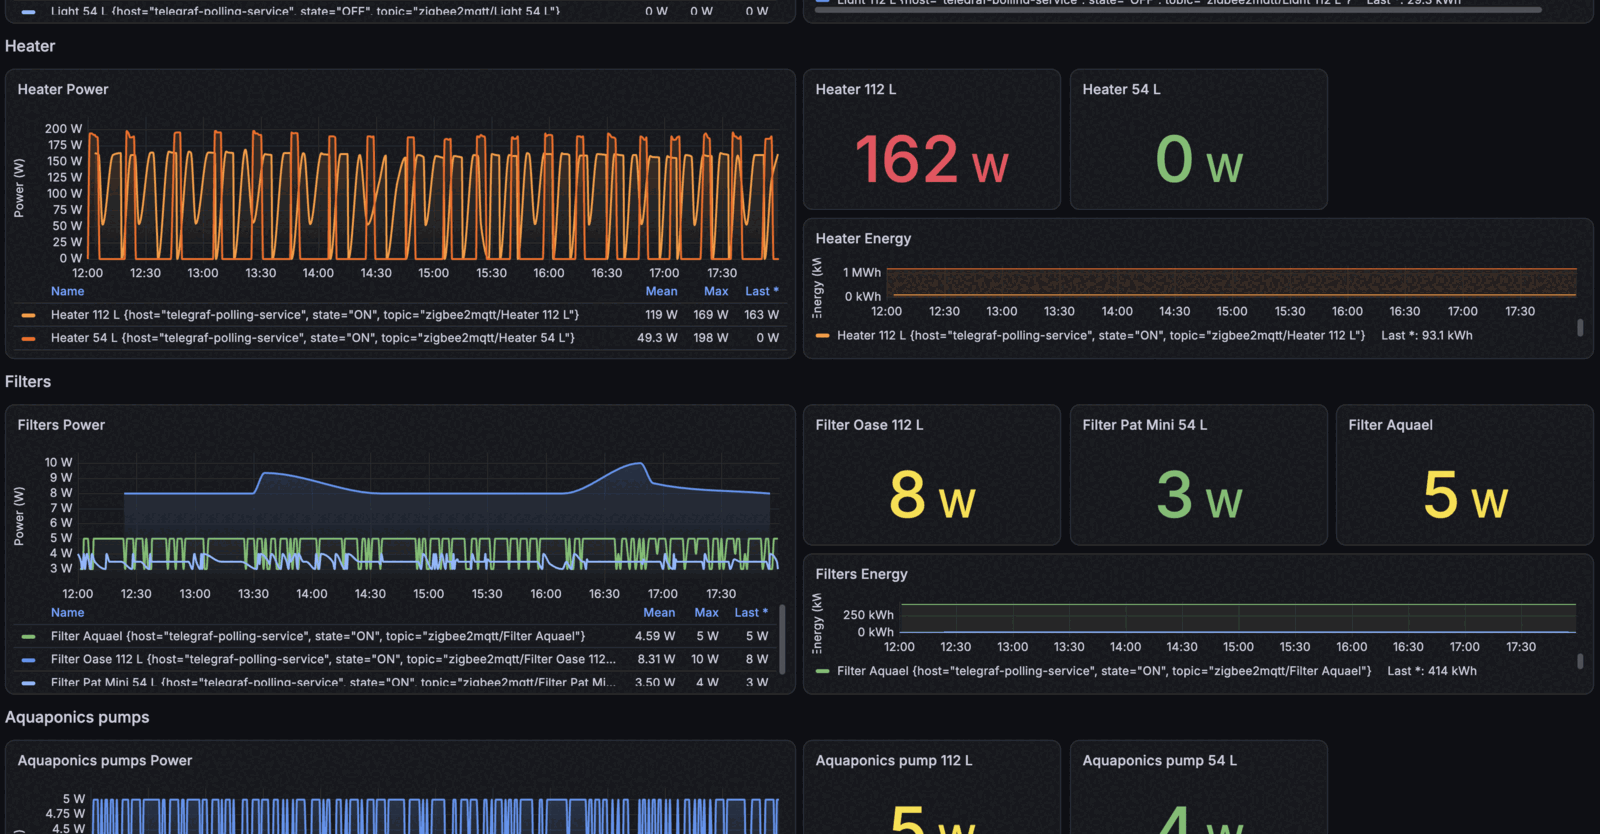
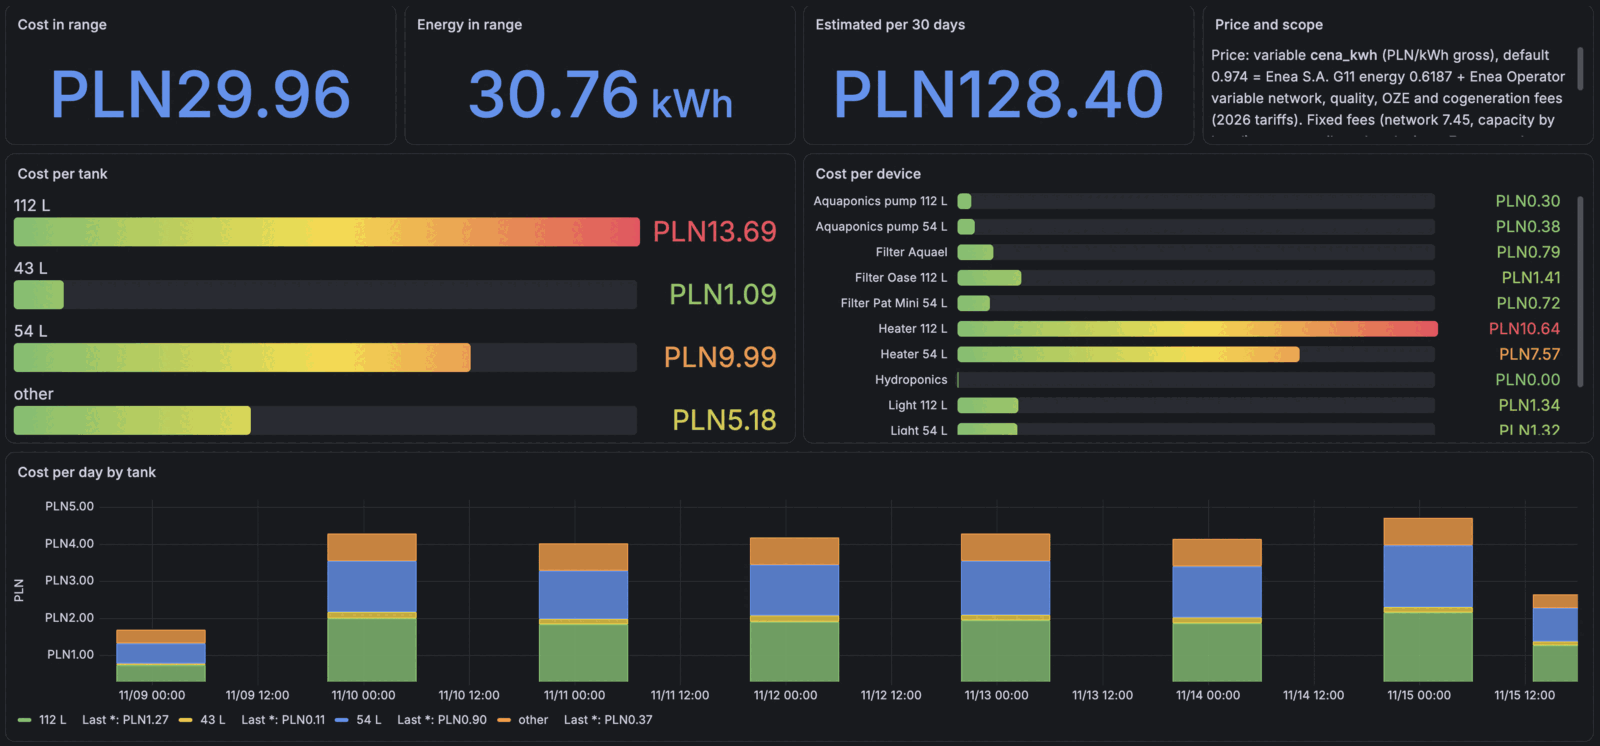
The plugs also report an energy counter, so the dashboard prices them. A cost row multiplies each counter’s increase by my electricity price and breaks it down per tank, per device and per day. Over one week the whole fish room cost about 30 PLN, and the two heaters were more than half of it.
The alerting side is VMRules evaluated by VictoriaMetrics: VerneMQDown fires when fewer than two nodes are scraped, VerneMQClusterPartitioned when a node has seen a member down for 10 minutes, and three Telegraf* rules cover the next hop.
One automation, end to end
One real event: the light on the 112 L tank switching on at 14:00 local time, reconstructed from the two buckets (times in UTC):
| Time (UTC) | Where | What |
|---|---|---|
| 13:00:00.384 | bucket homeassistant | turn_on_aquarium_lights runs |
| 13:00:00.454 | bucket mqtt | zigbee2mqtt/Light 112L reports state=ON, power=0 |
| 13:00:00.571 to 13:00:01.371 | bucket mqtt | four more reports, all state=ON, power=0 |
| 13:00:29.578 | bucket mqtt | power=49 |
The day before: the automation at 13:00:00.385, the first ON report at .452, and 48 W at 13:00:30.632.
Between the first two rows the event went through the local broker, zigbee2mqtt, the mesh and the plug’s relay, and back across the VPN to Telegraf and InfluxDB. The two timestamps come from different clocks (Home Assistant’s on the Pi, Telegraf’s receive time in the cluster), so I will not claim 70 milliseconds. I will claim “under a second”, which both days support.
The more interesting gap comes after that. The plug reported ON immediately and 0 W for almost thirty seconds. The relay closed; the measurement had not caught up. Like a pod that is Running but not ready, status and effect are different signals, and an alert that trusts the first will tell you the light is on while the tank sits in the dark.
The Home Assistant bucket holds two writes per automation run, about 3 ms apart (start and finish), and four at 14:00, where the time trigger and the 15-minute pattern fire together. The 13:00:00.384 in the table is the first run starting.
What broke before it worked
No tank overheated or flooded; what broke was the stack.
The doser kept writing to itself. One day the older Jebao pump closed any TCP session idle for about 15 seconds while the library pinged every 20, and on every reconnect HydroSense re-read the per-head calibration by switching a setting on the pump and back. Result: 36 writes to the pump in 6 minutes, on a device that should only be written when I ask. The fixes: a heartbeat of 8 seconds, below the firmware’s timeout, and no pump writes on reconnect. A reconciler that writes on every resync is just a loop with a side effect.
What works
The automations run at home and do not depend on the cluster. The history lives in the cluster, and one automation can be followed from Home Assistant to the database in under a second. The bridge lives on one node by design, and a restart delays messages rather than losing them. Precise water temperature measurements, automatic top-off, pH measurements and heater safeguards are still to come, in HydroSense (my aquarium controller) and in the HydroHabitat app.
All four tanks are running, but they are young: the nitrogen cycle has not closed yet, so ammonia and nitrite still come from a test kit. The stack is ahead of the biology.