What Your Observability Actually Costs

TL;DR: Observability costs are usually discussed as a vendor invoice, which is the least interesting part. The bill you actually pay is four things: cardinality (labels multiply, and one unbounded label multiplies everything downstream), retention (a slider you have to keep moving, not a decision you make once), memory (chart defaults are sized for somebody else’s cluster), and attention (an alert you have learned to ignore costs more than the disk it runs on). This post measures all four on my own k3s cluster, with the commands to measure them on yours, and it opens with a cardinality bomb I found while writing it - in my own Collector config.
This is the companion piece to a talk I gave at MAUG Kraków on 9 September, and the third part of a set. The first was about shaping telemetry with OTTL in the Collector - enrich, redact, cut cardinality. The second was about profiling as the fourth signal - what it is and where it is still sharp. Both of those posts assume the thing this one questions: that you know what your telemetry is costing you.
Most people do not, and I include myself. I run a small k3s cluster with VictoriaMetrics, Loki, Tempo, Grafana and an OpenTelemetry Collector. Every number below comes from the development cluster, measured on 17 September 2026; that is why mistwolf-dev-master shows up in the output. No observability vendor sends me an invoice at the end of the month. That does not mean it is free - it means the bill arrives as OOMKills, full volumes, and alerts I stopped reading.
The bill nobody sends you
Four cost centres, roughly in order of how badly they scale against you:
| Cost centre | What it actually is | How it shows up |
|---|---|---|
| Cardinality | Unique label combinations per metric | Memory in the TSDB, slow queries, then a full volume |
| Retention | How long each signal stays queryable | Disk, then object storage, then egress |
| Memory | Requests and limits across the stack | OOMKills, crashloops, and a cascade of false alerts |
| Attention | Alerts and dashboards you maintain | The one cost that has no metric |
Every vendor pricing page covers the first two. Nobody bills you for the last one, which is why it is the one that gets you.
Cost centre 1: cardinality
Cardinality is the number of unique time series a metric produces, and it is multiplicative. A metric with five labels of ten values each is not fifty series, it is up to 100,000. The failure mode is not gradual: one label with unbounded values - a user ID, a raw URL path, a pod name - turns a well-behaved metric into a series-per-request generator.
VictoriaMetrics will tell you exactly who the offenders are. Start here:
# top metrics by series count, straight from the TSDB status endpoint
kubectl -n monitoring port-forward svc/vmsingle-vm-victoria-metrics-k8s-stack 8429:8429 &
curl -s 'http://localhost:8429/api/v1/status/tsdb' | jq '.data.seriesCountByMetricName[:10]'

# and the label that is doing the damage
curl -s 'http://localhost:8429/api/v1/status/tsdb' | jq '.data.seriesCountByLabelValuePair[:10]'
[
{ "name": "otel_duration_milliseconds_bucket", "value": 55370 },
{ "name": "etcd_request_duration_seconds_bucket", "value": 46512 },
{ "name": "apiserver_request_duration_seconds_bucket", "value": 43824 },
{ "name": "longhorn_rest_client_rate_limiter_latency_seconds_bucket", "value": 39886 },
{ "name": "apiserver_request_sli_duration_seconds_bucket", "value": 26048 },
{ "name": "longhorn_rest_client_request_latency_seconds_bucket", "value": 12815 }
]And the label pairs underneath:
[
  { "name": "prometheus=monitoring/vm-victoria-metrics-k8s-stack", "value": 513528 },
  { "name": "beta_kubernetes_io_arch=amd64",                       "value": 190636 },
  { "name": "job=kubelet",                                         "value": 190382 },
  { "name": "node=mistwolf-dev-master",                            "value": 136302 },
  { "name": "kubernetes_io_hostname=mistwolf-dev-master",          "value": 125647 }
]
My own span metrics are the single largest metric family in the database, ahead of etcd and the API server. The label list underneath is the more useful half: job=kubelet alone carries 190k series, and a single node accounts for 136k. Nothing here is a leak. This is what a default install costs before anybody does anything wrong.
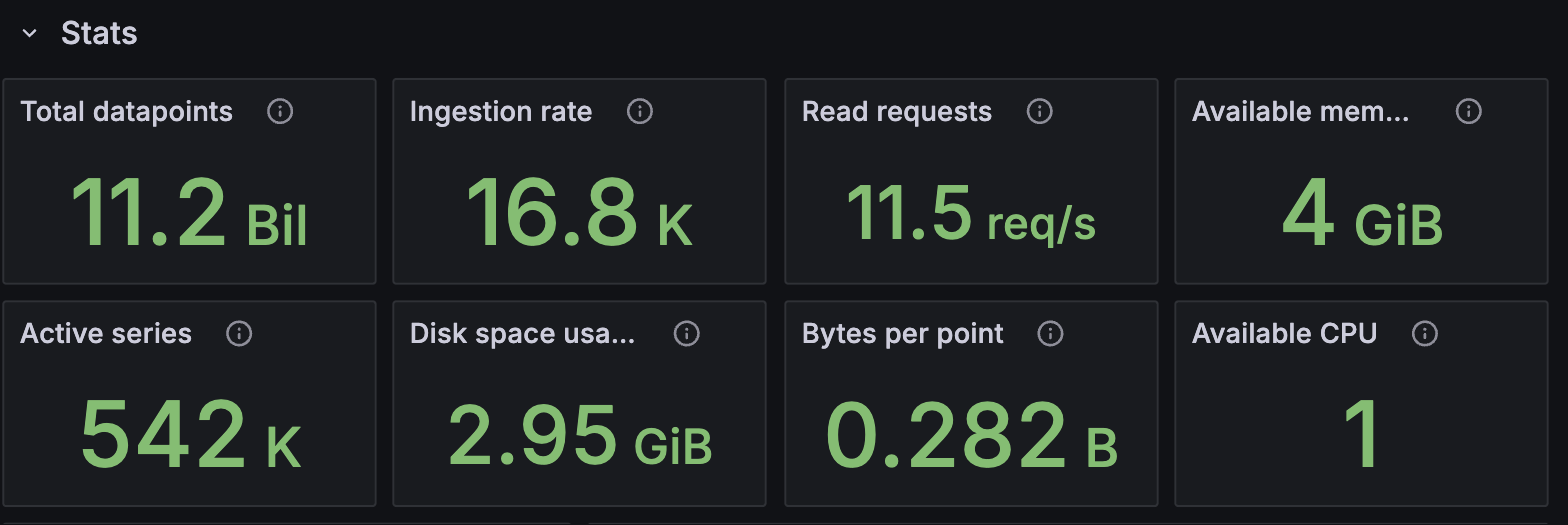
The same database an hour later, from the VictoriaMetrics dashboard. Active series reads 542k against the 584k the API returned earlier, and the gap is the point rather than an error: series churn as pods roll. 11.2 billion datapoints at 0.282 bytes each, which is the compression doing most of the work that retention gets credit for.
The bomb in my own config
I wrote this section expecting to explain cardinality with a textbook example. Then I read my own Collector values file. The spanmetrics connector turns every span into RED metrics, and mine is configured like this:
spanmetrics:
  namespace: otel
  dimensions:
    - name: http.method
    - name: http.status_code
    - name: http.route
    - name: http.target     # <- unbounded
    - name: k8s.namespace.name
http.route is the templated path, /blog/:slug, which is bounded by the number of routes. http.target is the raw request path including the query string. Every distinct URL anybody or any crawler requests becomes its own label value, and therefore its own set of histogram series - multiplied by every bucket in the latency histogram, of which I have thirteen.
The second one is quieter and worse:
prometheusremotewrite:
  resource_to_telemetry_conversion:
    enabled: true
That flag promotes every resource attribute to a metric label. My k8sattributes processor is configured to attach k8s.pod.name, k8s.pod.uid and k8s.replicaset.name. Pod names change on every rollout. Pod UIDs change on every restart. So each deploy silently retires one set of series and starts another, forever, and the TSDB keeps them all until retention expires.
This is exactly the class of problem OTTL exists to fix, and the previous post in this series has the tools for it: normalise the path, bucket the status code, drop the attribute before it ever becomes a label. I wrote the article about the fix five weeks before I noticed I needed it. That is the honest version of how this goes.
# which otel_ metrics exist at all
curl -s 'http://localhost:8429/api/v1/label/__name__/values' | jq -r '.data[]' | grep '^otel_'

# how many series does one of them actually carry? NOT series/count - see below
curl -s 'http://localhost:8429/api/v1/status/tsdb' \
  | jq '.data.seriesCountByMetricName[] | select(.name | startswith("otel_"))'
otel_calls_total
otel_duration_milliseconds_bucket
otel_duration_milliseconds_count
otel_duration_milliseconds_sum
{ "name": "otel_duration_milliseconds_bucket", "value": 55370 }One command in that block is a trap I walked into while collecting this. /api/v1/series/count looks like it takes a match[] selector, and it accepts one without complaining. It ignores it. On this cluster it returns 2,667,903 regardless of what you ask about, because it counts every series in storage. The number that answers the question is the per-metric breakdown in status/tsdb, which puts otel_duration_milliseconds_bucket at 55,370 series - thirteen histogram buckets multiplied by every distinct combination of the dimensions above.
Cost centre 2: retention is a slider, not a decision
Retention is where the naive mental model does the most damage. You do not pick a number once. You pick a number, the cluster grows, and the number becomes wrong without telling you.
Mine has moved twice, both times reactively:
| When | Change | Why |
|---|---|---|
| Initial | 7d local | Felt reasonable |
| PR #287/#288 | 7d to 3d, plus daily S3 backup | Cap on-disk growth, keep history off-cluster |
| PR #390 | 3d to 1d | vmsingle volume filling up |
One day of local metrics sounds absurd until you see the second half of the design: a vmbackup sidecar snapshots the volume nightly and ships it to Hetzner Object Storage. Local retention is a query cache; the archive lives in S3. Loki is on a 30 day retention against the same object storage, and Tempo is on 14 days.
Or rather, Tempo’s config says 14 days, with this comment next to it:
retention: 336h # 14 days - matches VictoriaMetrics retentionVictoriaMetrics has not been on 14 day retention since before that comment was written. The comment is not wrong about Tempo, it is wrong about the reason, and a wrong reason is what survives into the next person’s decision. Worth its own rule: a retention value without a dated justification next to it is a number nobody will dare to change.
# what is actually on disk, per signal
kubectl -n monitoring exec -it vmsingle-vm-victoria-metrics-k8s-stack-0 -- du -sh /victoria-metrics-data
kubectl -n monitoring exec -it loki-0 -- du -sh /var/loki
kubectl -n monitoring get pvc -o custom-columns=NAME:.metadata.name,SIZE:.spec.resources.requests.storage,SC:.spec.storageClassName
3.3G /victoria-metrics-data
NAME SIZE SC
grafana 10Gi longhorn
influxdb-influxdb2 2Gi longhorn
storage-loki-0 5Gi longhorn
storage-tempo-0 3Gi longhorn
vmsingle-vm-victoria-metrics-k8s-stack 30Gi longhornNote the gap between provisioned and used: 30 GiB claimed for metrics, 3.3 GiB on disk. Longhorn replicates every one of those gibibytes, so the PVC size is not a ceiling you set and forget, it is storage you are paying for on every replica from the moment you claim it.
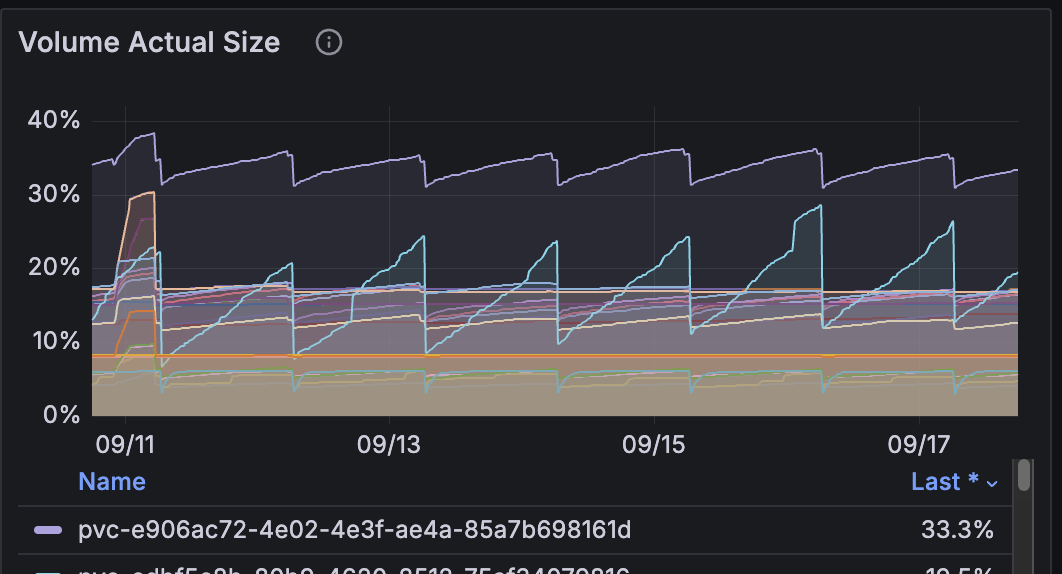
This is what a retention setting looks like from the storage layer, over seven days across 28 Longhorn volumes. Every sawtooth is a volume filling up and a retention window expiring. The slider is not a decision you made once; it is the thing drawing that pattern, over and over, whether or not you remember setting it.
And the part that made the retention story expensive rather than merely annoying: the backup sidecar had a 128Mi memory limit. It was OOMKilled roughly 30% into a ~1GB upload every single night, which leaked one VictoriaMetrics snapshot per day onto the very volume the backup was supposed to protect. The volume filled up. There had been no completed backup since 8 June, and nothing alerted on it, because “backup finished” was not a metric anybody was exporting. The fix (PR #476) was one line: 128Mi to 512Mi.
A backup that fails silently is not a cheap backup. It is a full-price backup with the value removed.
Cost centre 3: memory, and defaults sized for somebody else
Every component in an observability stack ships with chart defaults, and chart defaults are a guess about a cluster that is not yours. Here is the actual right-sizing history from my control-plane repo, which is a more honest cost breakdown than any pricing calculator:
| Component | Change | Trigger |
|---|---|---|
| vmsingle | memory limit to 2Gi, then 4Gi | OOMKill, then a Longhorn over-provisioning cascade |
| vmagent | 256Mi to 768Mi | OOM crashloop: steady state ~83Mi, but a single 32MB scrape plus parsing spikes far above it |
| vmagent | CPU 250m to 1 | CPUThrottlingHigh - the scraper was being throttled into lateness |
| vmbackup | 128Mi to 512Mi | Nightly OOMKill mid-upload (above) |
| Tempo | 1Gi to 2Gi | OOMKill at exit 137 after 12 days of uptime |
| Loki chunks-cache | chart default 8Gi to 1Gi | The default memcached ask was larger than some of my nodes |
That last row is the one worth staring at. Every other line is me giving a component more than the default. One line is me taking away eight gigabytes that a chart asked for by default and that I would have paid for indefinitely without noticing, because nothing was broken. Defaults are a cost you opt into by not reading.
The vmagent row has a second lesson in it. Steady-state memory was around 83Mi and the limit was 256Mi, which looks like a 3x safety margin and is not. The kubelet /metrics response on the control-plane node exceeds the default 16MB scrape limit, so it is configured up to 32MB - and a single 32MB scrape, parsed, is a spike that has nothing to do with steady state. Sizing on the average is how you get paged at the p99.
# what the stack is actually using right now, versus what it is allowed
kubectl -n monitoring top pod --sort-by=memory
kubectl -n monitoring get pods -o custom-columns=\
'NAME:.metadata.name,REQ:.spec.containers[*].resources.requests.memory,LIM:.spec.containers[*].resources.limits.memory'

# and who has been killed for it
kubectl -n monitoring get events --field-selector reason=OOMKilling --sort-by=.lastTimestamp
NAME CPU MEMORY
vmsingle-vm-victoria-metrics-k8s-stack-78d88589b8-xlktr 138m 1842Mi
loki-chunks-cache-0 2m 1053Mi
loki-0 17m 452Mi
tempo-0 3m 430Mi
opentelemetry-collector-56bbfc846b-45rbq 6m 339Mi
grafana-74dfdcfbf6-f8rs5 29m 322Mi
...
loki-results-cache-0 2m 21Mi
NAME REQ LIM
loki-chunks-cache-0 1229Mi 1229Mi
loki-results-cache-0 1229Mi 1229Mi
vmsingle-vm-victoria-metrics-k8s-stack-78d88589b8-xlktr 1Gi,128Mi 4Gi,512Mi
tempo-0 256Mi 2Gi
loki-0 256Mi 512Mi
opentelemetry-collector-56bbfc846b-45rbq 128Mi 512Mi
# OOMKilling events:
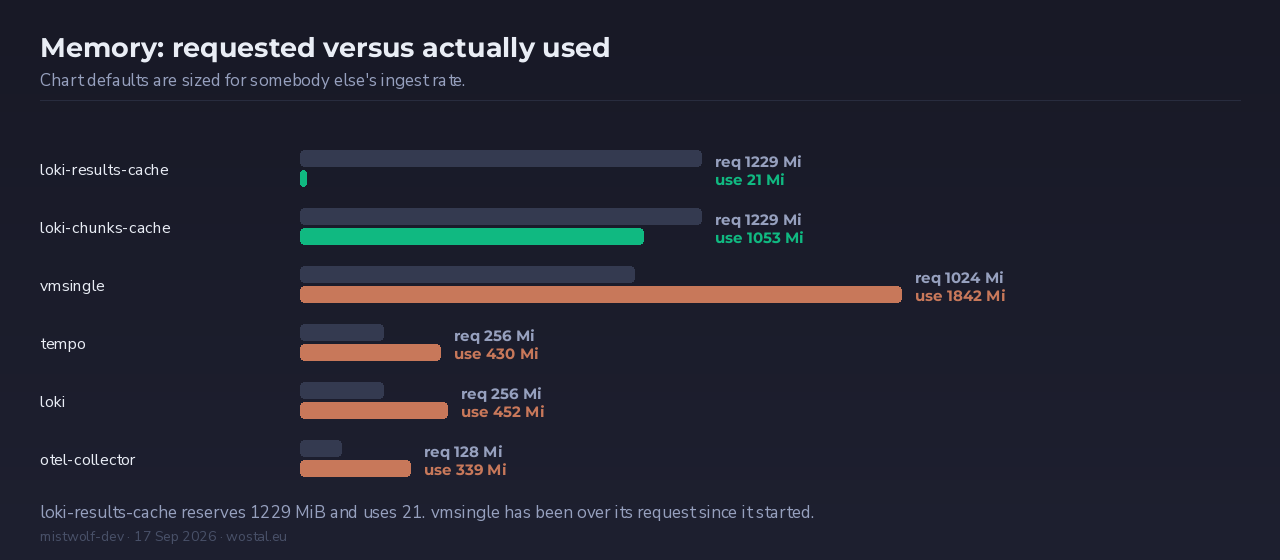
(none)Two things in that output are worth stopping on. vmsingle is using 1842 MiB against a 1 GiB request - it has been over its request since it started, which is fine until the node gets busy and the scheduler starts believing the request. And the two Loki cache pods request 1229 MiB each, hard-limited to the same value, which is 2.4 GiB of the namespace reserved before a single log line arrives. loki-results-cache-0 is using 21 MiB of its 1229 MiB. That is not a leak either. That is a chart default sized for somebody else’s ingest rate, copied into a cluster that will never approach it.
Nothing has been OOM killed. The cost here is not crashes, it is capacity quietly removed from the schedulable pool.
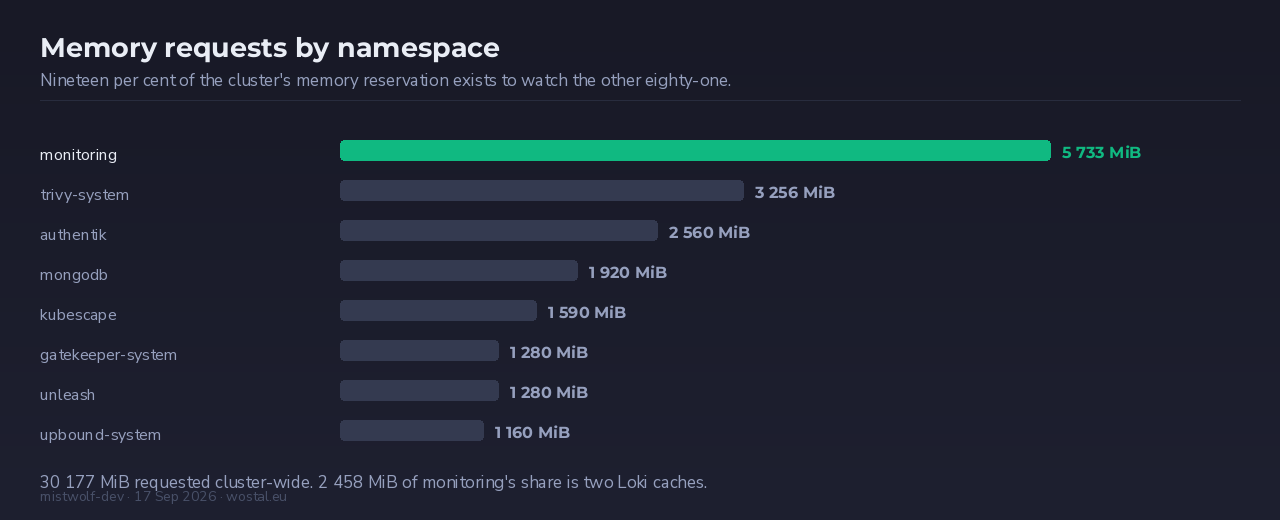
Add it up and the monitoring namespace is the single largest memory reservation in the cluster - larger than any workload it watches:
# monitoring's share of total cluster memory requests, summed properly
kubectl get pods -A -o json | jq -r '
  def tomib:
    if . == null or . == "" then 0
    elif endswith("Gi") then (rtrimstr("Gi")|tonumber) * 1024
    elif endswith("Mi") then (rtrimstr("Mi")|tonumber)
    elif endswith("Ki") then (rtrimstr("Ki")|tonumber) / 1024
    else (tonumber / 1048576) end;
  [ .items[] | {ns: .metadata.namespace,
     mem: ([ .spec.containers[].resources.requests.memory // "0" | tomib ] | add)} ]
  | group_by(.ns) | map({ns: .[0].ns, mib: (map(.mem) | add | round)})
  | sort_by(-.mib)'
monitoring 5733 MiB
trivy-system 3256 MiB
authentik 2560 MiB
mongodb 1920 MiB
kubescape 1590 MiB
gatekeeper-system 1280 MiB
----
total cluster requests: 30177 MiB
monitoring: 5733 MiB (19%)Nineteen per cent of the cluster’s memory requests exist to watch the other eighty-one. And 2.4 GiB of that 5.7 GiB is the two Loki cache pods from the previous block, one of which is using under two per cent of what it reserved. The headline ratio is defensible. The composition of it is not, and you only see the composition if you go looking.
Cost centre 4: attention
This is the one that has no line item, so here is a concrete price for it.
On 28 May, an alert routing change meant seven of eight critical alerts went to a blackhole receiver and never reached Telegram. The cause was structural rather than dramatic: the VictoriaMetrics operator injects a namespace=<config-ns> matcher onto every VMAlertmanagerConfig subtree, so any alert not carrying namespace=monitoring - NginxDown from the tenant namespaces, InfluxDBDown, TelegrafDown, KubeletDown - fell through to the chart’s default root receiver, which is a blackhole. The monitoring stack was healthy. The alerts were firing. The dashboards were green. Nothing arrived.
The mirror image of that failure is just as expensive. k3s folds the controller-manager and the scheduler into the server process, so there are no scrape endpoints for them - and the default Kubernetes rule set therefore fires KubeControllerManagerDown and KubeSchedulerDown permanently, on a perfectly healthy cluster. Both rule groups are now disabled. Before that, they were training me to skim past a page of red.
An alert you have learned to ignore is worse than no alert, because it costs you the attention and the false confidence. Two things are worth measuring here, and neither is on a vendor pricing page:
# what is firing right now - if you cannot say which of these are real,
# that is the finding
curl -s --get 'http://localhost:8429/api/v1/query' \
  --data-urlencode 'query=sort_desc(sum by (alertname)(ALERTS))' | jq '.data.result'
[ { "alertname": "CPUThrottlingHigh" },
{ "alertname": "InfoInhibitor" },
{ "alertname": "Watchdog" } ]Three alerts firing, and two of them are plumbing: Watchdog fires permanently by design so you can detect a dead alerting path, and InfoInhibitor exists to suppress other alerts. The only one carrying information is CPUThrottlingHigh, which on this cluster has been firing long enough that I read past it. That is the attention bill, rendered as a three-line list.
The second measurement is the one I want you to actually run, because it is the cheapest thing in this entire post and it would have caught the May incident in a single command:
# does the path from a firing alert to your phone actually work?
# note the pod name - the VictoriaMetrics operator prefixes it, so it is not
# the chart's default alertmanager-*
kubectl -n monitoring exec vmalertmanager-vm-victoria-metrics-k8s-stack-0 -- \
  amtool config routes test --config.file=/etc/alertmanager/config/alertmanager.yaml \
  alertname=NginxDown namespace=mt-prod severity=critical
Run it against an alert that does not come from your monitoring namespace. That is the case that breaks, and the receiver name it prints is the whole answer.
So what does it cost
Real numbers, measured on the dev cluster on 17 September 2026:
| Item | Figure |
|---|---|
| Scrape targets | 119 |
| Scrape interval | 30s |
| Local metrics retention | 1 day (archive in S3) |
| Log retention | 30 days (S3-backed) |
| Trace retention | 14 days |
| Metrics series count | 584,243 active (2,667,903 total in storage) |
| Monitoring namespace memory requests | 5,733 MiB of 30,177 MiB cluster-wide (19%) |
| Hetzner Object Storage, monthly | EUR 6.49 flat base fee; 17.88 TB-hours over six buckets billed at zero |
| Engineering time, right-sizing incidents | 6 documented PRs since May |
That last row is the real answer to the title. The object storage line is small enough that I have never once thought about it. The six PRs are evenings.
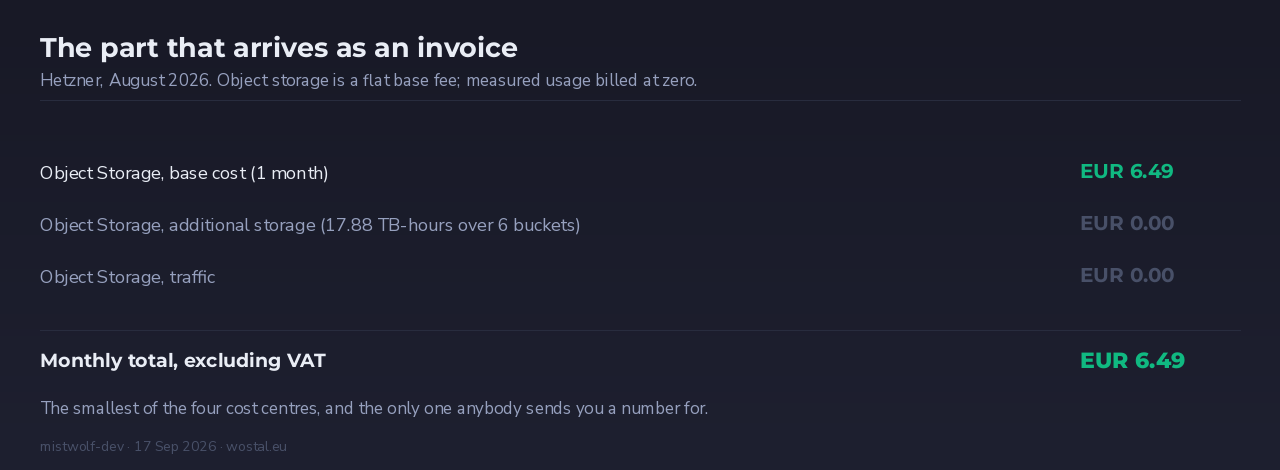
Six euros and forty-nine cents, and it is a flat fee: the 17.88 TB-hours actually consumed across six buckets were billed at zero. That is the entire portion of this bill that arrives as a number somebody else calculated for me. Everything else in this post - half a million series, 5.7 GiB of reserved memory, a volume redrawing the same sawtooth every few days, an alert I have trained myself to skim past - had to be gone looking for.
What I would tell someone starting
- Measure cardinality before you need to.
/api/v1/status/tsdbtakes ten seconds and you will find something. I did, in the config I wrote myself. - Never put a raw path, a user ID or a pod name in a metric label.
http.route, nothttp.target. Check whatresource_to_telemetry_conversionis quietly promoting. - Date every retention value’s justification. The number is easy to change; the unexplained number is not.
- Size limits on spikes, not averages. The 32MB scrape, not the 83Mi steady state.
- Read the chart defaults you are accepting. One of mine wanted 8Gi.
- Test the alert path from outside the monitoring namespace. One
amtoolcommand.
The honest limits of this post
This is one small cluster. Seven tenants, a single VMSingle rather than a VMCluster, a SingleBinary Loki, one Collector replica. The shape of the four cost centres holds at any size - cardinality is multiplicative everywhere, defaults are somebody else’s guess everywhere - but the numbers do not transfer, and anyone running a real multi-tenant platform will find my figures charmingly small.
Two things I have not measured and should be honest about. I have no benchmark for what OTTL processing itself costs at volume; the OTTL post flagged the same gap and it is still open. And I have not put a number on the cost of the telemetry I am not collecting - the incidents that took longer to diagnose because a signal was retained for one day instead of seven. That is the cost that never appears in any of these tables, and it is the argument against every optimisation in this post.
The point is not that observability should be cheap. It is that “we do not know what it costs” and “it is free” are different sentences, and most stacks are running on the first one while telling themselves the second.
I gave this talk at MAUG Kraków on 9 September. If you were in the room, tell me which of my numbers is wrong.