From Git Push to Production Without a CI Vendor

TL;DR: Every one of my projects ships the same way: a push to Codeberg fires a webhook, Argo Events catches it, Argo Workflows runs the pipeline in my cluster, semantic-release cuts the tag, the image and Helm chart land in an OCI registry, Kargo notices the new version and walks it through environments, and Argo Rollouts does a blue/green switch that a k6 load test has to approve first. There is no CI vendor anywhere in that sentence. The entire control plane is one versioned repo. This post is the map; the next posts in the series zoom into each stage.
Why I evicted my CI vendor
The decision was not a spreadsheet moment. When I moved my repos from GitHub to Codeberg, I lost Actions overnight - and my first instinct was to go shopping for a replacement SaaS. Then I looked at the cluster that already ran Argo CD and Argo Rollouts and asked a simpler question: why does CI live somewhere else than CD in the first place? I never found a good answer, so instead of renting a new build server I taught the cluster to build for itself. This series is what that looks like a year later.
Three honest reasons, before the architecture:
- The cluster already ran Argo CD and Argo Rollouts. Adding Events and Workflows meant one more chart, not one more vendor.
- A runner inside the cluster sees the same network, secrets and storage as the workloads it builds for. Half of my old CI pain was the runner living somewhere else. I wrote about the other half in I Let an AI Re-Platform My CI Pipeline: six latent bugs, every one of them an environment difference, not a logic error.
- Portability. My pipelines are CRDs. Backing them up, reviewing them and restoring them is
git clone, not an export button.
The map
flowchart LR
    push["git push<br/>(Codeberg)"] --> webhook["Webhook"]
    webhook --> events["Argo Events<br/>EventSource + Sensor"]
    events --> wf["Argo Workflows<br/>tenant-main-pipeline"]
    wf --> sr["semantic-release<br/>tag vX.Y.Z"]
    sr --> events2["Argo Events<br/>(tag event)"]
    events2 --> wf2["Argo Workflows<br/>tenant-tag-pipeline"]
    wf2 --> oci[("OCI registry<br/>image + Helm chart")]
    oci --> kargo["Kargo Warehouse<br/>freight"]
    kargo --> rollout["Argo Rollouts<br/>blue/green + k6 analysis"]
    rollout --> prod["prod"]
One repo, drift-warden, holds all of it: the ApplicationSets, the pipeline templates, the Kargo projects, the Helm values. The application repos stay clean. wostal.eu, the site you are reading, contributes exactly four files to its own deployment: a Dockerfile, a Helm chart, .releaserc.json and renovate.json.
Stage 1: the push and the catch (Argo Events)
A Codeberg webhook hits an EventSource in the cluster. Per-tenant Sensors decide what fires: a push to main triggers tenant-main-pipeline, a fresh tag triggers tenant-tag-pipeline, a PR triggers tenant-pr-pipeline. The webhook endpoint is deliberately boring: an HTTPRoute on the gateway (httproute-codeberg-webhook) is the only way in, a NetworkPolicy pins the EventSource pod so nothing else can talk to it, and the webhook secret lives in an ExternalSecret - the cluster pulls it, nobody pastes it.
Watching the catch happen is one command:
kubectl -n argo-events get eventsources,sensors
# eventsource/codeberg-tenants   sensors: codeberg-wostal-eu, codeberg-mistwolf-tech,
# codeberg-mistwolf-cloud, codeberg-hydro-habitat, codeberg-itomm-pl,
# codeberg-devopslaboratory-org, codeberg-amateur-alchemist (one per tenant)

kubectl -n argo-events logs -l sensor-name=codeberg-wostal-eu -f
# 14:18:13.093 info  not interested in dependency tag (didn't pass filter)   trigger=tag-workflow
# 14:18:13.094 warn  Event [ID '3810eb630c03...', Source 'codeberg-tenants'] ...
# 14:18:13.094 info  not interested in dependency pr (didn't pass filter)    trigger=pr-workflow
# 14:18:13.095 info  Triggering actions after receiving dependency push      trigger=push-workflow
#
# Name:       wostal-eu-main-qgkgj
# Namespace:  argo-workflows
# Status:     Pending
# Created:    Thu Aug 27 14:18:14 +0000 (now)
# Parameters:
#   repo:     mistwolftech/wostal-eu
That is one webhook arriving and three triggers deciding about it. tag-workflow and pr-workflow both look at the same event and both decline - the filters are what make a single EventSource serve every kind of push - and push-workflow takes it and creates the workflow, named in the same second the webhook landed. Nothing polls. The two “not interested” lines are the interesting ones: they are the sensor doing its job, not noise.
Anti-pattern break: the CLI-first rule
A rule for this whole series: everything is shown CLI-first, with real output, and the UI appears only where it genuinely beats the terminal - a DAG mid-run, a promotion pipeline at a glance. If a step only works by clicking, it does not go in the article. You should be able to reproduce every stage of this post over SSH.
Stage 2: the pipeline is a CRD (Argo Workflows)
tenant-main-pipeline is a WorkflowTemplate assembled from reusable steps in tenant-steps: git-clone, helm-lint, then semantic-release. Lint green means semantic-release runs, decides whether the commits earn a release, and cuts the tag. The tag loops back through Argo Events into tenant-tag-pipeline, which builds the image and pushes it, together with the Helm chart, to the OCI registry on Codeberg. (Signing is currently the control plane’s own privilege: drift-warden cosigns its own releases, tenant images are not signed yet - it is on the list.)
The whole run, from the terminal:
argo -n argo-workflows list --since 24h
# NAME                              STATUS      AGE   DURATION   PRIORITY   MESSAGE
# monitoring-selfcheck-1787835000   Succeeded   4m    10s        0
# ci-pipeline-deadman-1787834220    Succeeded   17m   20s        0
# wostal-eu-main-mb4bv              Succeeded   42m   2m         0
# monitoring-selfcheck-1787769000   Failed      18h   5m         0   Pod was active on the
#                                                                    node longer than the
#                                                                    specified deadline

argo -n argo-workflows get wostal-eu-main-mb4bv
# Name:                wostal-eu-main-mb4bv
# Namespace:           argo-workflows
# Status:              Succeeded
# Created:             Thu Aug 27 14:12:05 +0200 (42 minutes ago)
# Duration:            2 minutes 22 seconds
# Progress:            3/3
# Parameters:
#   repo:              mistwolftech/wostal-eu
#   chart-name:        wostal-eu
#   sha:               c7e1c4e8a851cea3eae31cf6485a28f61056504f
#   branch:            refs/heads/main
#
# STEP                     TEMPLATE                       DURATION  MESSAGE
#  v wostal-eu-main-mb4bv  main
#  |-v clone               tenant-steps/git-clone         20s
#  |-v lint                tenant-steps/helm-lint         14s
#  \-v release(0)          tenant-steps/semantic-release  1m

kubectl get clusterworkflowtemplates      # cluster-scoped blocks: git-checkout, helm-lint, jira-sync, yaml-validate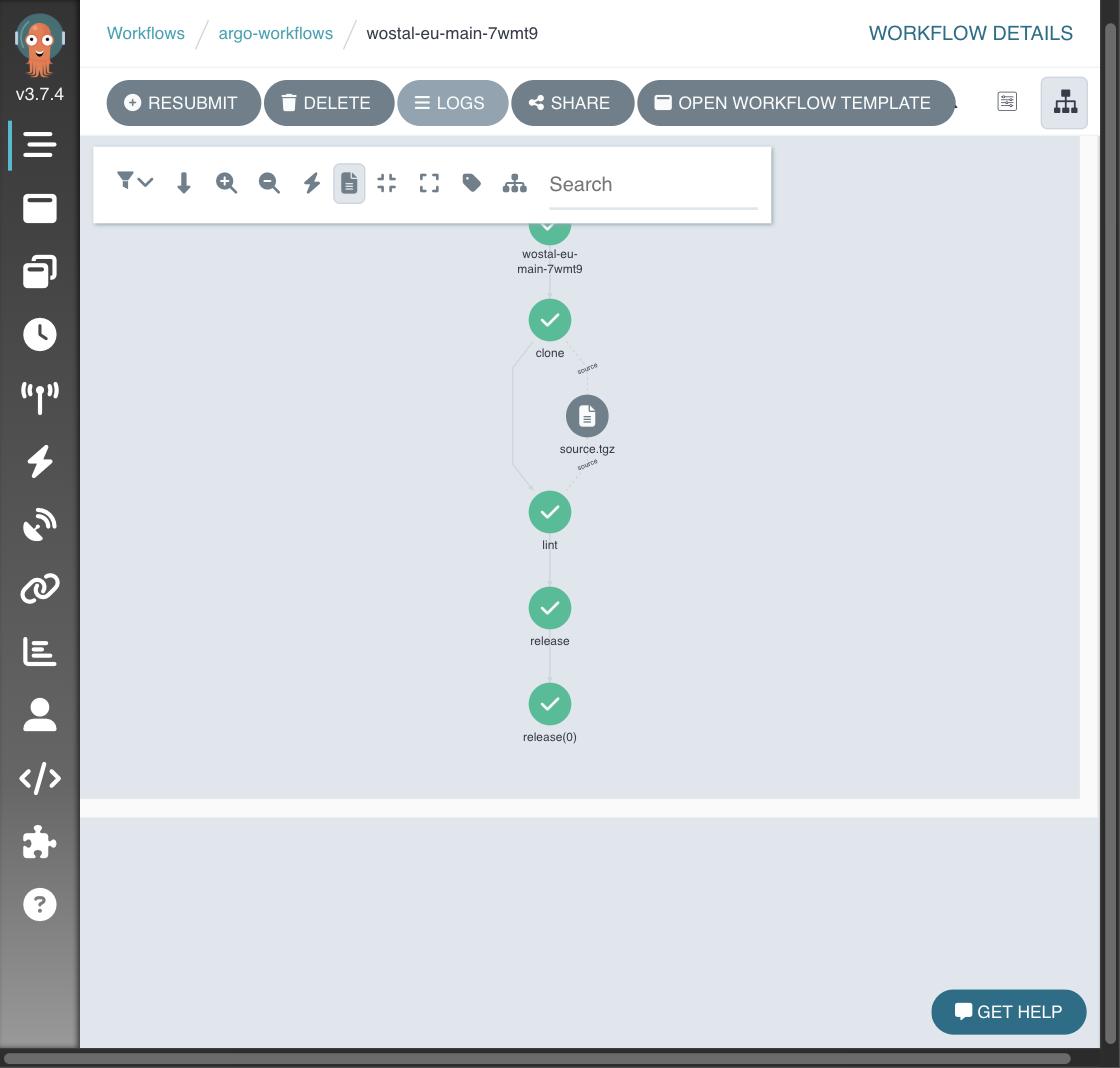
Two things in that output are worth pausing on. The workflow is named after the tenant, not the template - tenant-main-pipeline is the WorkflowTemplate, wostal-eu-main-mb4bv is one run of it, and every tenant produces its own. And the ci-pipeline-deadman sitting two rows above is the cron that watches the watcher.
A caveat I only found by needing it: argo logs on a finished workflow returns nothing unless persistence.archive is set on the controller. Mine configured a PostgreSQL archive and never enabled it, so completed workflows showed ARCHIVED=false in the UI and their logs died with the pods that podGC had already removed. A configured archive is not an enabled one.
That fix was incomplete, and I only noticed weeks later when I went looking for a specific release log. podGC: OnWorkflowCompletion still deletes the pod the moment the workflow ends, so both readers that stream from a live pod come back empty: argo logs <workflow> prints nothing, and the UI log panel spins and then quietly suggests “try getting logs from the artifacts”. Which is the answer. archiveLogs: true had been doing its job the whole time, writing main.log to the S3 bucket next to the source tarball. The log is there; two of the three ways to read it are dead ends:
argo logs -n argo-workflows wostal-eu-main-7wmt9        # nothing
# the UI log panel: also nothing

# the artifact, which is where it actually lives:
curl -s "$ARGO/artifact-files/argo-workflows/workflows/wostal-eu-main-7wmt9/\
wostal-eu-main-7wmt9-67194771/outputs/main-logs"
# [semantic-release] i  Found 1 commits since last release
# [commit-analyzer]  i  The release type for the commit is patch
# [commit-analyzer]  i  Analysis of 1 commits complete: patch release
# [semantic-release] i  The next release version is 1.23.1
# [semantic-release] v  Created tag v1.23.1
# [semantic-release] v  Published release 1.23.1 on default channel
# === Result: success - Release completed ===
That block is the whole argument for this architecture in eight lines. One commit carrying a fix: prefix, an analyzer that classifies it, and a version that falls out of a rule rather than out of somebody’s judgement. Nobody typed 1.23.1 anywhere.
A detail I refuse to give up: a ci-deadman CronWorkflow. If the pipeline infrastructure itself breaks, I find out from the deadman, not from a release that silently never happened. It has earned its keep: on 19 August it failed three runs in a row while I was rotating CI tokens - the cron told me the pipeline was broken before any tenant release had a chance to silently not happen.
Stage 3: promotion is data, not a script (Kargo)
A Kargo Warehouse watches the registry for semver tags. New tag means new freight. Seven independent Kargo projects run on the platform, one per application. Five run the same two stages (dev, then prod); the interesting differences are in the promotion policy, not the shape: hydro-habitat runs dev and a public beta with no prod stage at all, amateur-alchemist carries four (dev, qa, int, prod), and wostal.eu auto-promotes both stages while mistwolf.tech keeps a human on the button (more on that below). Promotion between stages commits the new image.tag into drift-warden and waits for Argo CD to sync. Git stays the source of truth even for “what version runs where”.
For scale, a release of this very site, timed end to end on 17 September. I merged a one-line accessibility fix at 18:39:03 and did nothing else:
18:39:03  merge to main
18:41:35  main pipeline done      2m32s   semantic-release cuts v1.23.1
18:43:58  tag pipeline done       2m08s   image and chart in the registry
18:44:33  Warehouse sees 1.23.1   0m35s   freight volted-umbrellabird
18:45:02  dev promoted
18:48:02  prod promoted           k6 gates passed on both stages
18:48:45  the fix is live
Four minutes from image push to production; nine minutes and forty-two seconds from the merge. Both numbers matter, and the gap between them is not build time - it is spec.interval on the Warehouse, which is five minutes. I got lucky here and the poll landed 35 seconds after the image appeared. Land it badly and the same release takes five minutes longer without a single byte being compiled. If you benchmark a pipeline like this, say which clock you started.
kargo get freight --project wostal-eu
# NAME                                       ALIAS                 ORIGIN                AGE
# c3e418cac0d7d8ad25a41773afec9ea98ccd0c38   volted-umbrellabird   Warehouse/wostal-eu   4m59s
# 637f4d9ab81aabbddcc83f834b438efd19b1ed50   elegant-wasp          Warehouse/wostal-eu   19d
# 670ce173b59fd3eb0e833cd059a553c15a0a68aa   your-chipmunk         Warehouse/wostal-eu   21d

kargo get stages --project wostal-eu
# NAME   SHARD   CURRENT FREIGHT                            HEALTH    READY   STATUS
# dev            c3e418cac0d7d8ad25a41773afec9ea98ccd0c38   Healthy   True    Freight has been verified
# prod           c3e418cac0d7d8ad25a41773afec9ea98ccd0c38   Healthy   True    Freight has been verified

kargo promote --project wostal-eu --freight <id> --stage prod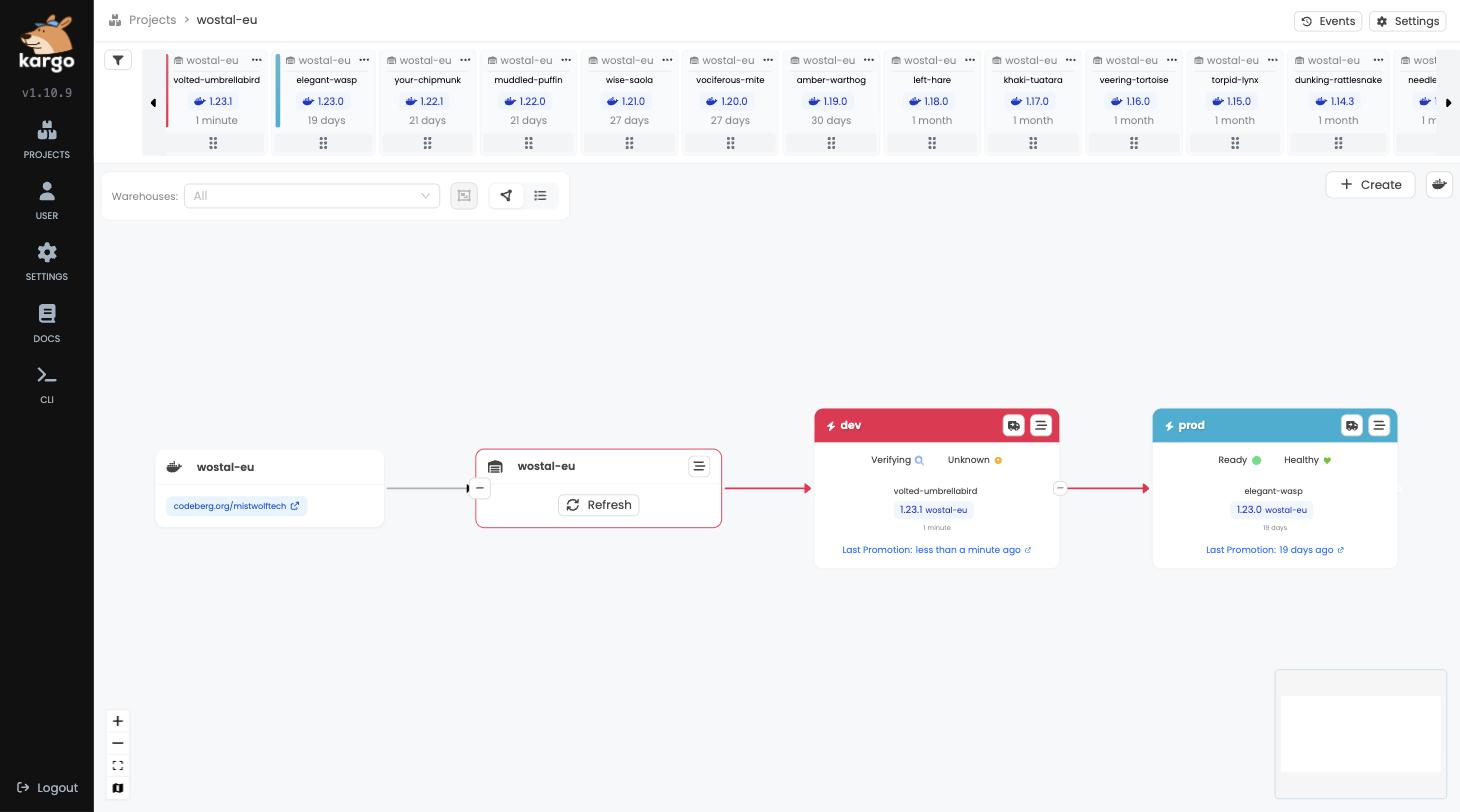
Look at the ages in that freight list and you can read my publishing history off it. Nineteen days between elegant-wasp and the release above, on a site that is supposed to ship weekly. Nothing was broken in any of this machinery during those nineteen days; the fault was a stale index.lock in a git repository on my laptop, upstream of everything shown here. The control plane cannot report an absence of pushes, and a dashboard full of green is exactly what that failure looks like. That is a different post, but the evidence for it is sitting in this command’s output.
Everything Kargo knows is a custom resource, which means none of this needs the Kargo CLI or a login to it:
kubectl -n wostal-eu get stages,freight,promotionsSame rows, same data. Kargo keeps no state outside the cluster - useful to know the day its API is the thing that is down.
Stage 4: the gate that says no (k6 + Argo Rollouts)
Every environment deploys blue/green with prePromotionAnalysis: a k6 smoke test (1 VU x 10 s) runs as a Job against the preview service before any traffic moves, and Kargo adds its own stage verification on top - k6-smoke-* plus a k6-load-kargo ramp to 20 VUs for about two minutes. Whether a human still sits between green analysis and live traffic is a per-tenant policy in plain values files: wostal.eu runs autoPromotionEnabled: true on dev and prod - the k6 analysis is the gate, not an operator - while mistwolf.tech keeps false on both and waits for a manual kubectl argo rollouts promote. Same machinery, different trust levels, one line of YAML apart.
The split matters more than it looks. Measured on a real promotion: Kargo’s stage verification on dev ran both jobs and took a couple of minutes, while the prePromotionAnalysis that Argo Rollouts runs immediately before flipping production traffic was the smoke test alone, Complete 1/1 in nineteen seconds. The expensive check happens where a failure costs nothing; the cheap one guards the moment that matters. If you build one of these, resist the urge to make the last gate the thorough one.
Full disclosure: in the retained history - 75 promotions across the two biggest projects, 38 recorded verifications - the gate had never actually said no. Every k6 run passed. That is a weak kind of confidence, because an untested gate and a broken gate look identical from the outside. So on 27 August I tightened the smoke threshold on main from p(95)<200 to p(95)<1, a value nothing can pass, and let the next real release walk into it.
An awkward footnote to that sentence, found while collecting the numbers for this post. On a smaller project on the same platform, the qa stage has been sitting on Metric "k6-smoke" assessed Failed due to failed (1) > failureLimit (0) since 2 June, a hundred and eleven days at the time of writing. The gate did say no, correctly, and then nothing happened, because Health: Healthy sits in the column next to Ready: False and the eye stops at the first one. I went looking for proof that my gate works and found proof that I do not read my own dashboards.
Two details make that safe to do. The threshold commit is a test(k6): commit, which the default commit-analyzer ignores, so it changes the gate without cutting a version. And every AnalysisRun clones main at runtime in a git-clone initContainer, so the new threshold applies to the very next verification regardless of which image is being promoted. The release that walked into it was real: 1.22.0, the zoxide post, merged that morning.
It behaved as advertised, and it failed faster than it passes. The AnalysisRun went from start to Failed in 19 seconds; a passing verification on this stage takes about two minutes. The k6 Job crossed the threshold, the AnalysisRun flipped to Failed, Argo Rollouts aborted the promotion, and the preview ReplicaSet scaled down without ever becoming active:
kubectl argo rollouts get rollout wostal-eu -n we-dev
# Name:            wostal-eu
# Namespace:       we-dev
# Status:          x Degraded
# Message:         RolloutAborted: Rollout aborted update to revision 41: Metric "k6-smoke"
#                  assessed Failed due to failed (1) > failureLimit (0)
# Strategy:        BlueGreen
# Images:          codeberg.org/mistwolftech/wostal-eu:1.21.0 (stable, active)
#
# NAME                                    KIND         STATUS        AGE    INFO
# @ wostal-eu                             Rollout      x Degraded    131d
# +--# revision:41
# |  +--[] wostal-eu-b49f5b4cd            ReplicaSet   . ScaledDown  5h12m  preview,delay:passed
# |  +--a wostal-eu-b49f5b4cd-41-pre      AnalysisRun  x Failed      5h12m  x 1
# |     +--# 815ead96-....k6-smoke.1      Job          x Failed      5h12m
# +--# revision:40
#    +--[] wostal-eu-7bc98546b5           ReplicaSet   v Healthy     6d4h   stable,active
#    +--a wostal-eu-7bc98546b5-40-pre     AnalysisRun  v Successful  6d4h   v 1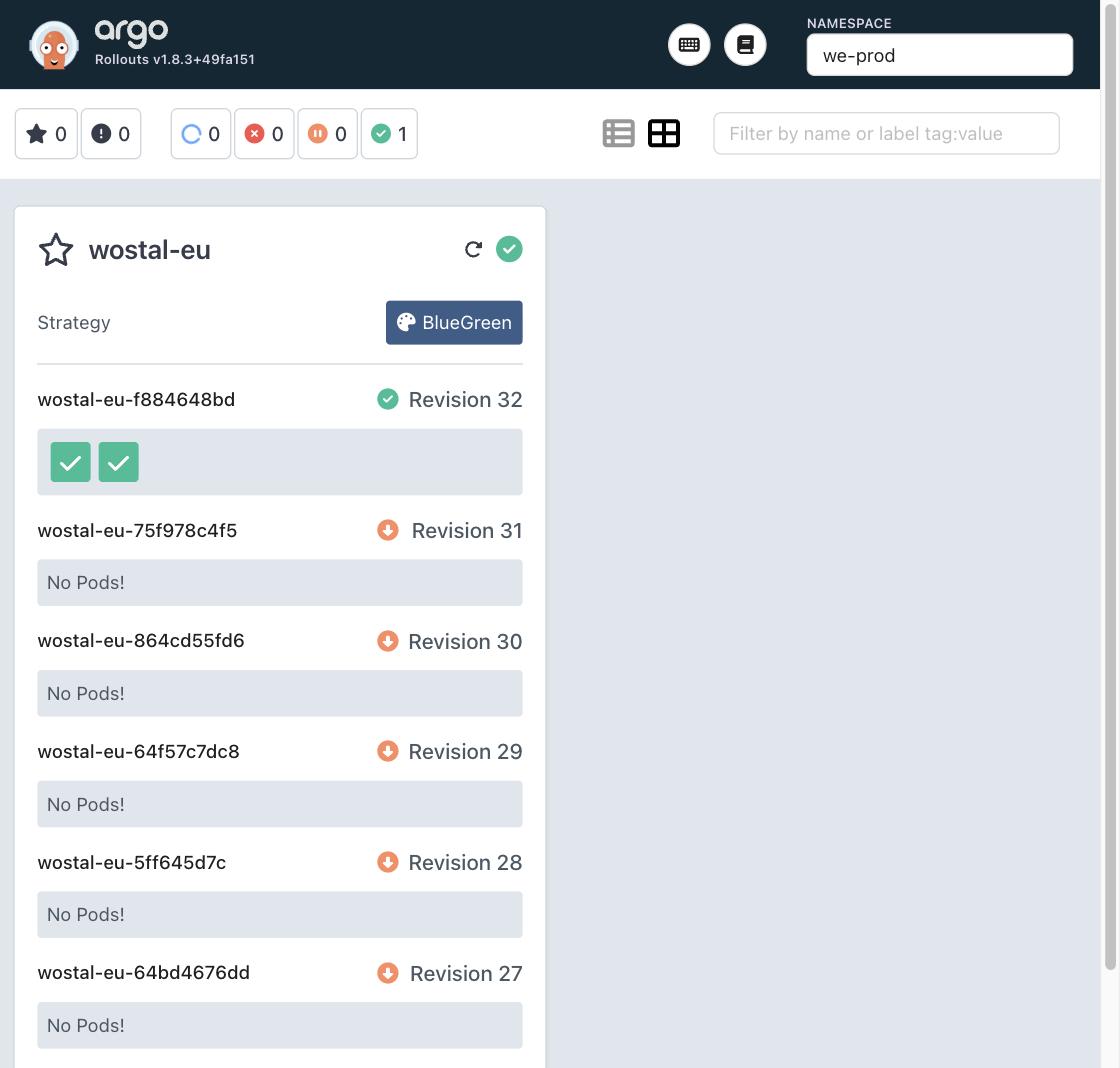
That is the steady state, after the switch. Six revisions are retained and exactly one has pods; the other five are the rollback targets, costing nothing but a ReplicaSet object each. During the switch itself both the outgoing and incoming sets run at full size, which for this rollout means four pods for the length of the analysis. That is the honest price of blue/green, and it is why the gate on that step is the cheap one.
Read the two revisions against each other. Revision 41 carries the new image and is ScaledDown; revision 40, six days old, is still stable,active. activeSelector never moved. Production stayed on 1.21.0 for as long as the gate stayed red, which in this case was about five hours, until I put the threshold back:
kubectl get analysisruns -n we-dev
# NAME                          STATUS       AGE
# wostal-eu-b49f5b4cd-41-pre    Successful   2m     # after restoring p(95)<200
# wostal-eu-7bc98546b5-40-pre   Successful   6d
# wostal-eu-7db895dfd4-39-pre   Successful   6d

kubectl argo rollouts retry rollout wostal-eu -n we-dev
One wrinkle worth recording, because it is the kind of thing that only shows up when you actually run the drill: restoring the threshold was not enough on its own. retry reported success and changed nothing, twice, because the Failed AnalysisRun for revision 41 still existed and the controller kept resolving back to it. The rollout only moved once that object was deleted and the retry repeated. Argo Rollouts is happy to tell you it retried something it did not retry.
After that, the same freight - byte-identical image, same 6d9e649 - went green in the normal two minutes, dev flipped, and autoPromotionEnabled carried 1.22.0 to prod on its own, blue/green analysis included. Total time the gate held a good release hostage: about five hours, all of it my doing.
That is the honest accounting. A gate that can say no can also say no for stupid reasons, and the blast radius of a false negative is a post that ships late. The blast radius of not having the gate is a bad build meeting live traffic. I will take the first one, and I now know the mechanism works, which is more than I could say for the previous 38 verifications.
I ran it a second time the same afternoon, deliberately, with the threshold tightened before the release rather than during it. The release was 1.22.1 - a genuine fix to this very chart - and it walked the whole path: Codeberg webhook, wostal-eu-main-qgkgj, semantic-release, wostal-eu-tag-67fp9, image push, Kargo promotion, and then the wall. Here are both k6 summaries, same image, same checks, differing only in what the threshold allowed:
# threshold p(95)<1 - blocked
checks.........................: 100.00% 20 out of 20
http_req_duration..............: avg=4.38ms  med=4.4ms  max=4.79ms  p(95)=4.67ms
http_req_failed................: 0.00%   0 out of 10
level=error msg="thresholds on metrics 'http_req_duration' have been crossed"

# threshold p(95)<200 - passed
checks.........................: 100.00% 20 out of 20
http_req_duration..............: avg=1.06ms  med=810us  max=2.93ms  p(95)=2.31ms
http_req_failed................: 0.00%   0 out of 10
Every check passed in both. No request failed in either. The site answered in single-digit milliseconds while being told that four milliseconds was unacceptable. That is what a false negative looks like from the inside: nothing is broken except the criterion, and the machinery cannot tell the difference. Which is the point - it is not supposed to. It enforces the number you gave it.
Getting those two blocks was harder than producing them, and the reason is worth passing on. The analysis Jobs carry ttlSecondsAfterFinished: 600, deliberately, so failed runs do not linger into the alerting window and re-page. Ten minutes is not a window you can catch by hand. Worse, kubectl logs was returning 502 Bad Gateway from the API server for every pod on that node - a broken kubelet connection unrelated to any of this, which I found only because I needed it. Both problems turned out to be irrelevant: the logs were in Loki the whole time, indexed by pod, surviving long after the Job and the node path that served them. The lesson is not about k6. If your log pipeline works, stop racing garbage collection.
One more thing broke quietly and is worth checking in your own cluster. The k6 Jobs push metrics to VictoriaMetrics with K6_PROMETHEUS_RW_TREND_AS_NATIVE_HISTOGRAM=true, and VictoriaMetrics does not ingest Prometheus native histograms. Counters and rates landed; every trend metric was dropped on write. k6_http_req_duration returned zero series across the entire retention window - the one number the gate decides on had never been recorded anywhere. Switching to classic trend stats with an explicit K6_PROMETHEUS_RW_TREND_STATS fixed it, and k6_http_req_duration_p95 now reads 0.00231 for the passing run above: 2.31 ms, matching the log exactly. A gate whose decision variable is invisible in your metrics stack is a gate you cannot audit after the fact.
What this costs
Honesty section, with numbers pulled from VictoriaMetrics (1-hour averages, whole namespaces):
| Component | Memory | CPU |
|---|---|---|
| Argo CD | 2.5 GiB | ~1.4 cores |
| Argo Events | 1.4 GiB | ~0.5 cores |
| Argo Workflows | 0.9 GiB | ~0.08 cores |
| Kargo | 0.4 GiB | ~0.04 cores |
| Argo Rollouts | 0.3 GiB | ~0.07 cores |
Roughly 5.5 GiB of RAM and two cores, around the clock, to replace a CI vendor. The surprise in that table is not the newcomers - Events, Workflows, Kargo and Rollouts together cost less than half of what Argo CD itself does. Reconciliation is the expensive part, and I was already paying it before this architecture existed. Maintenance runs three to five hours a month - mostly merging Renovate PRs for the chart versions and the occasional pipeline debugging session when an upgrade shifts some behaviour underneath me. The steel-man for a CI vendor: if you have no cluster running 24/7, none of this makes sense; GitHub Actions is free for less effort. This architecture pays off at the point where the cluster already exists and CD already lives in it.
Where the series goes next
Each stage above gets its own deep dive: Argo Events and Workflows (the CI that lives in your cluster), Kargo (promotion as a first-class citizen), k6 as a quality gate, and ephemeral PR environments from ApplicationSets. They land here as they are published.