
Unifying My Smart Home and Homelab: Bridging Home Assistant MQTT to a Kubernetes Data Platform
February 7, 2026
TL;DR: This post details how I bridge the MQTT broker from Home Assistant (which gets data from Zigbee sensors via Zigbee2MQTT) to a second, more powerful EMQX broker running on my Kubernetes homelab. This data is then captured by Telegraf, stored in InfluxDB for the long term, and visualized in Grafana. This creates a scalable, robust, and decoupled data platform for all my smart home metrics.
I run Home Assistant for my smart home automation, and it’s fantastic. It integrates with hundreds of devices and services. But as my collection of sensors grew, I found myself wanting more than what the default history and dashboard tools could offer. I wanted long-term data retention, powerful query capabilities, and the ability to create customized analytical dashboards without putting extra load on my Home Assistant instance.
My homelab, detailed in a previous post, already has a powerful data stack running on Kubernetes: EMQX, InfluxDB, and Grafana. The logical next step was to connect the two worlds.
In this post, I’ll walk you through the entire process of integrating Home Assistant with a Kubernetes-based data platform. We will bridge two MQTT brokers to create a unified data firehose, store that data permanently, and build beautiful dashboards.
By the end of this post, you will understand:
- The roles of Home Assistant, Zigbee, Zigbee2MQTT, and MQTT.
- The architecture for bridging two EMQX brokers.
- How to configure Telegraf to subscribe to MQTT topics and write to InfluxDB.
- How to build a Grafana dashboard to visualize your smart home data using Flux queries.
The Core Components: What is What?
Before we get to the “how,” let’s quickly define the key players in this setup.
Home Assistant (HA): An open-source home automation platform that acts as the central brain for a smart home. It’s where you create automations like “if motion is detected, turn on the light.” It can run on a Raspberry Pi, a dedicated device, or as a VM.
Zigbee: A low-power wireless communication protocol used by many smart home devices (sensors, bulbs, switches). It creates a mesh network, where devices can relay signals for each other, increasing reliability and range.
Zigbee2MQTT: A brilliant piece of software that acts as a translator. It connects to a physical Zigbee USB coordinator, communicates with all your Zigbee devices, and translates their proprietary signals into clean, standardized MQTT messages. This is the key that unlocks your Zigbee data from vendor-locked hubs.
MQTT: The Message Queuing Telemetry Transport protocol. It’s an extremely lightweight publish/subscribe messaging protocol, perfect for IoT devices. Devices “publish” messages on a “topic” (e.g.,
zigbee2mqtt/Big Aquarium Lights), and other services “subscribe” to that topic to receive the messages.EMQX: A massively scalable, enterprise-grade MQTT broker. In this setup, we have two: one running as a simple Add-on inside Home Assistant to service Zigbee2MQTT, and a second, more robust instance running on our Kubernetes cluster to act as the central data hub.
The Goal: A Unified, Long-Term Data Platform
Why go to all this trouble? Why not just use Home Assistant’s built-in database?
Traditional Home Assistant Setup:
graph TD
    A[Zigbee Sensor] --> B[Zigbee2MQTT];
    B --> C[HA MQTT];
    C --> D[Home Assistant DB];
    subgraph Drawbacks
        direction LR
        E[Limited history];
        F[Data stuck in HA];
        G[High DB load];
    end
    D --> E & F & G;
Our Integrated Homelab Architecture:
graph TD
    subgraph Legend
        direction LR
        H1[Long-term storage];
        H2[Powerful analytics];
        H3[Decoupled platform];
    end

    A[Zigbee Sensor] -- Zigbee --> B[Zigbee2MQTT];
    B -- MQTT --> C[HA MQTT];
    C -- MQTT Bridge --> D[k8s EMQX];
    D -- Subscribes --> E[Telegraf];
    E -- Writes --> F[InfluxDB];
    F -- Queries --> G[Grafana];
    F --> H1 & H2 & H3;
This architecture decouples the critical automation functions of Home Assistant from the resource-intensive task of data storage and analysis.
Architecture Diagram
Here is the flow of data from a physical sensor all the way to our dashboard.
graph TD
    A[Zigbee Temp Sensor] -- Zigbee --> B[Zigbee Coordinator USB Stick];
    B --> C[Zigbee2MQTT Add-on];
    C -- MQTT --> D[Home Assistant EMQX Add-on];
    D -- MQTT Bridge --> E[k8s EMQX Service];
    E -- Subscribes --> F[Telegraf Pod];
    F -- Writes --> G[InfluxDB];
    G -- Queries --> H[Grafana];
    E -- Subscribes --> I[Other Apps];
Deeper Look: The Integration Steps
Step 1: Bridge Kubernetes EMQX to Home Assistant MQTT
The first step is to configure the EMQX broker on the Kubernetes cluster to bridge the connection to the MQTT broker running in Home Assistant. This is done in the cd-homelab repository, in the values/emqx/local/homelab/values.yaml file.
This configuration defines an ingress bridge that subscribes to all topics (#) from the Home Assistant MQTT broker and republishes them locally on the cluster’s EMQX. The credentials for the Home Assistant MQTT broker are loaded from a Kubernetes secret.
# In values/emqx/local/homelab/values.yaml
emqxConfig:
  # ...
  # MQTT Bridge from Home Assistant EMQX
  # Credentials loaded from secret via envFromSecret below
  EMQX_BRIDGES__MQTT__HA_BRIDGE__ENABLE: "true"
  EMQX_BRIDGES__MQTT__HA_BRIDGE__PROTO_VER: "v5"
  EMQX_BRIDGES__MQTT__HA_BRIDGE__CLEAN_START: "true"
  # Ingress: subscribe to all topics from HA and republish locally
  EMQX_BRIDGES__MQTT__HA_BRIDGE__INGRESS__REMOTE__TOPIC: "#"
  EMQX_BRIDGES__MQTT__HA_BRIDGE__INGRESS__REMOTE__QOS: "1"
  EMQX_BRIDGES__MQTT__HA_BRIDGE__INGRESS__LOCAL__TOPIC: "${topic}"
  EMQX_BRIDGES__MQTT__HA_BRIDGE__INGRESS__LOCAL__QOS: "${qos}"
  EMQX_BRIDGES__MQTT__HA_BRIDGE__INGRESS__LOCAL__RETAIN: "${retain}"
This configuration creates a bridge named HA_BRIDGE. It forwards every single message (# is the wildcard for all topics) from the Home Assistant broker to the k8s broker.
After applying the Helm chart with these values, the EMQX broker on the cluster will connect to the Home Assistant MQTT broker and start receiving messages.
Step 2: Configure Telegraf to Consume MQTT Data
Now that the data is flowing into our cluster’s EMQX, we need a service to grab it and put it into our database. That service is Telegraf.
In this homelab setup, Telegraf is deployed via a Helm chart, and the configuration is taken directly from the values/telegraf/common/values.yaml file. It’s configured to subscribe to a wide range of topics and use a general-purpose JSON parser.
# values/telegraf/common/values.yaml

# ...

config:
  # ...
  outputs:
    - influxdb_v2:
        urls:
          - "http://influxdb-influxdb2.monitoring.svc.cluster.local:80"
        token: "$INFLUX_TOKEN" # This is loaded from a secret
        organization: "homelab"
        bucket: "mqtt"

  inputs:
    - mqtt_consumer:
        servers:
          - "tcp://emqx.emqx.svc.cluster.local:1883"
        topics:
          - "homeassistant/#"
          - "zigbee2mqtt/#"
          - "+/+/#"
        qos: 1
        persistent_session: false
        client_id: "telegraf-homelab"
        data_format: "json"
        topic_tag: "topic"
After applying this configuration, Telegraf will:
- Connect to the
emqxservice in theemqxnamespace. - Subscribe to all topics under
zigbee2mqtt/#(and others). - Use the standard
jsonparser to flatten the data. For a message tozigbee2mqtt/Big Aquarium Lightslike{"state": "ON", "brightness": 254, "power": 150}, it will create fields namedstate,brightness, andpower. - Add a tag named
topiccontaining the full MQTT topic (e.g.,zigbee2mqtt/Big Aquarium Lights). - Write the data into the
mqttbucket in InfluxDB.
Step 3: Visualize the Data in Grafana
This is the fun part. With data flowing into InfluxDB, we can now build dashboards.
Add InfluxDB as a Data Source: In Grafana, go to Connections -> Data Sources, and add an InfluxDB data source. Point it to your InfluxDB service (
http://influxdb-influxdb2.monitoring.svc.cluster.local:80from within the cluster) and provide your organization, bucket (mqtt), and token details.Create a New Panel: On a dashboard, create a new panel and select your InfluxDB data source. Switch to the code editor to write a Flux query.
Example Flux Query: Power consumption of multiple lights
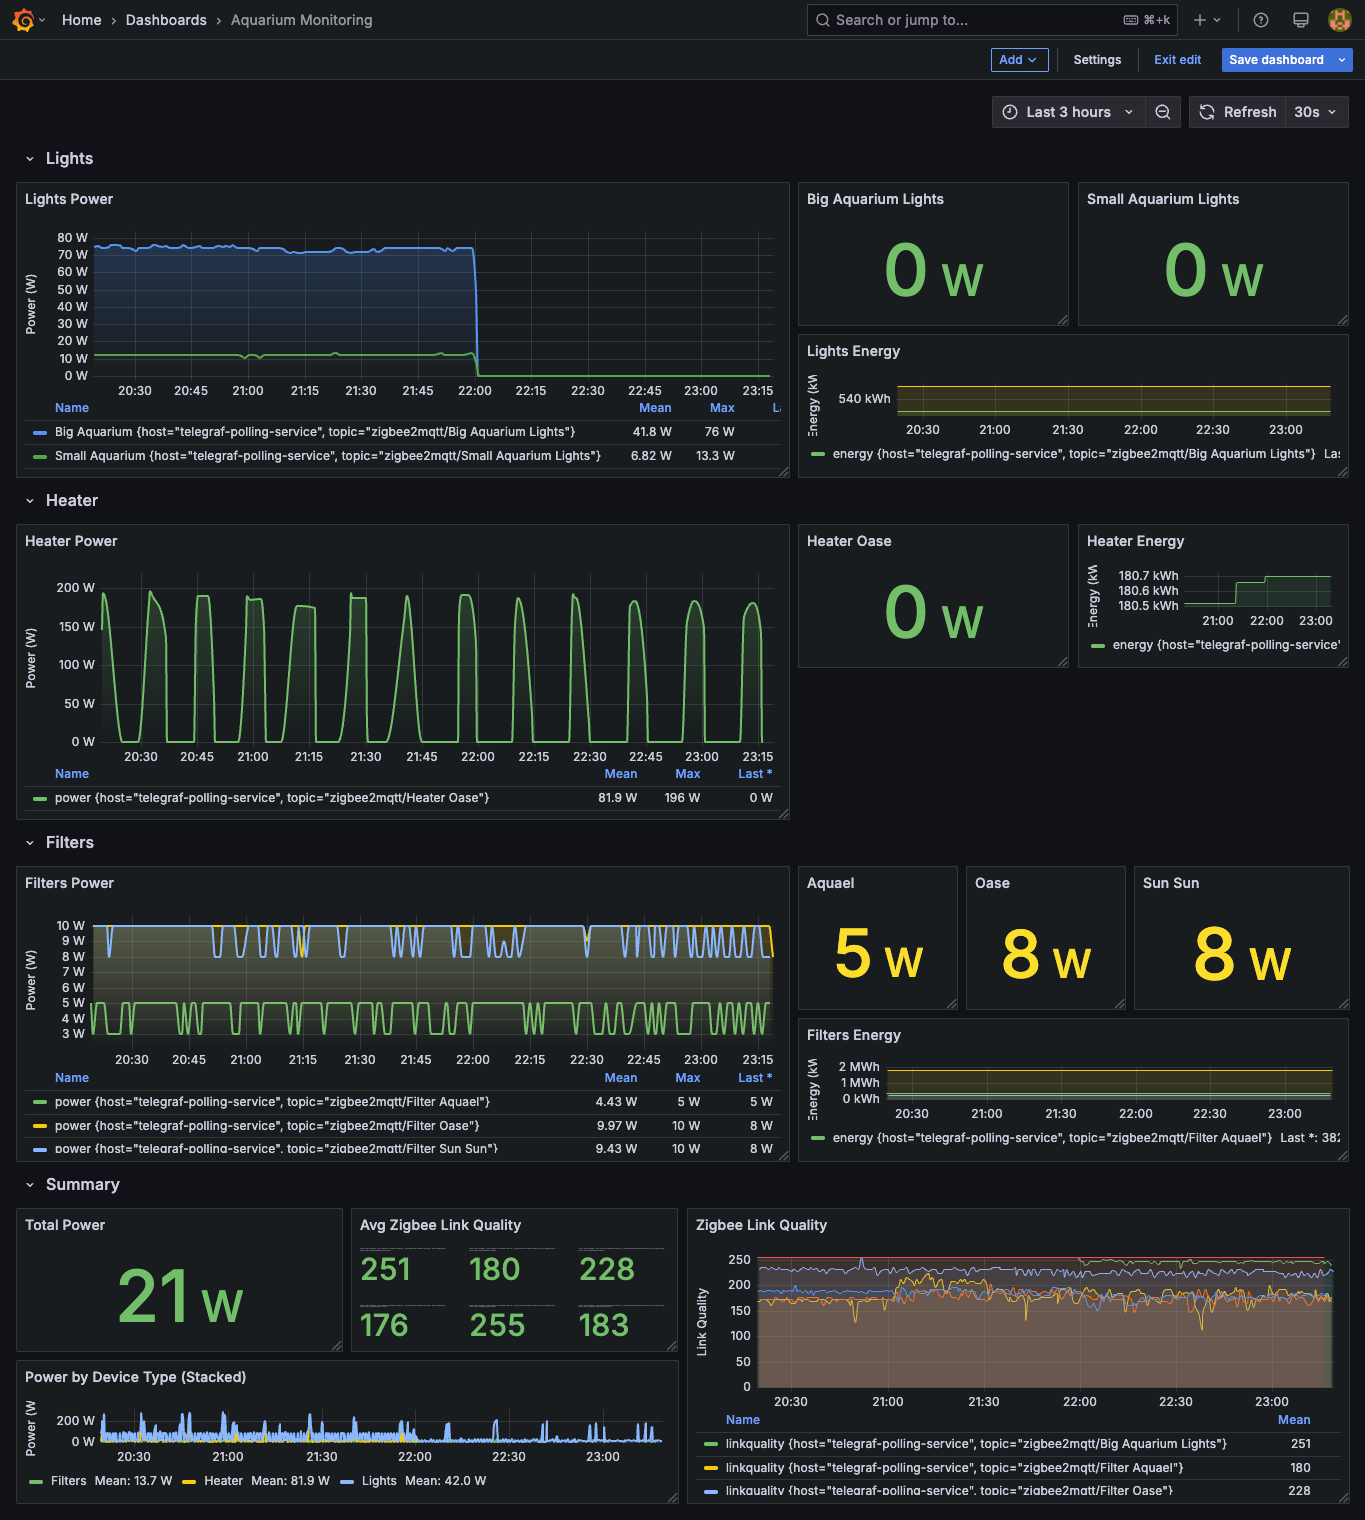
A simple query for one sensor is useful, but in a real dashboard, you often want to compare multiple devices. The dashboard-configmap.yaml in this repository contains a great example. Let’s look at the query for the “Lights Power” panel, which graphs the power consumption of two different aquarium light sets and gives them friendly names for the legend.
from(bucket: "mqtt")
  |> range(start: v.timeRangeStart, stop: v.timeRangeStop)
  |> filter(fn: (r) => r._measurement == "mqtt_consumer")
  |> filter(fn: (r) => r.topic == "zigbee2mqtt/Big Aquarium Lights" or r.topic == "zigbee2mqtt/Small Aquarium Lights")
  |> filter(fn: (r) => r._field == "power")
  |> aggregateWindow(every: v.windowPeriod, fn: mean, createEmpty: false)
  |> map(fn: (r) => ({ r with _field: if r.topic == "zigbee2mqtt/Big Aquarium Lights" then "Big Aquarium" else "Small Aquarium" }))
Let’s
from,range,filterby measurement: These are the same as before, setting up the basic data retrieval.filter(fn: (r) => r.topic == ... or r.topic == ...): Here, we select data from two different MQTT topics in a single query.filter(fn: (r) => r._field == "power"): We are interested only in thepowerfield from the JSON payload.aggregateWindow(...): This is the same as before, smoothing the data.map(...): This is the clever part. Themap()function transforms each row. We check thetopicfor each row and dynamically change the_fieldvalue. If the topic is for the big aquarium, the field becomes “Big Aquarium”; otherwise, it becomes “Small Aquarium”. This results in a clean legend on the graph, instead of showing the raw topic names.
This query will produce a single graph panel with two distinct, clearly labeled time series, one for each light.
Summary and Benefits
Integrating Home Assistant with a dedicated Kubernetes data platform was a game-changer for my homelab. It required some initial setup, but the benefits are undeniable.
| Benefit | Description |
|---|---|
| Scalability & Perf. | My Home Assistant instance is now leaner, focusing only on real-time automation. The heavy lifting of data processing is offloaded to the cluster. |
| Long-Term Storage | I can now keep high-resolution sensor data for years instead of days, allowing for long-term trend analysis (e.g., yearly temperature cycles). |
| Advanced Analytics | InfluxDB’s Flux query language is incredibly powerful. I can perform complex joins, math, and transformations that are impossible in Home Assistant. |
| Decoupling | The data platform is completely independent. I can restart, update, or even completely rebuild my Home Assistant instance without any data loss. |
| Unified Dashboard | I can combine smart home data with other metrics from my homelab (e.g., server temperatures, network traffic) on a single Grafana dashboard. |
This project perfectly embodies the spirit of a homelab: taking powerful, open-source tools and integrating them to build a system that is greater than the sum of its parts.
All the Kubernetes and application configurations for this setup are available in the cd-homelab repository. I encourage you to explore it and adapt it for your own projects.